Best Infographics
Economics is an incredibly wide field and the use of accurate and attractive infographics, illustrations and diagrams is justified and gives high results. The infographics are the best to show the key economics concepts and to illustrate the answers to the key economics questions. An overview of a field in overall and key economic topics, depiction of relationships between the system's components is easy to make in infographics. They allow displaying useful examples from the economics of different countries in a visual form, making microeconomic and macroeconomic analysis.
Infographics help to display data from mathematical economics, financial economics, digital economics, political economics, economic statistics, and econometrics. They are the best way to display economic phenomena, economic indicators, reflect their quantitative changes, and observe statistical parameters and economic results. They allow visually display and analyze the ups and downs, relationships between economic entities.
The economy specialists use actively data visualization tools, illustrations, infographics, charts, maps, dashboards, and more in their work. The best way to design the visual infographics and diagrams fast and simply is to use the tools of the Economy Infographics solution from the Business Infographics area of ConceptDraw Solution Park.
Design your best infographics in economics faster and easier, increase your productivity in creating precise illustrations, diagrams, and schematics by simply dragging and dropping the ready-made clipart, pictograms, and icons on your infographics. Design presentations and infographics about economics, economic policy, local regional and global markets, business, finances, government and social institutions, production, distribution, and consumption of goods and services in minutes in ConceptDraw DIAGRAM solution enhanced with Economy Infographics solution.
The attractive and scaled economic infographics designed in ConceptDraw DIAGRAM are the best for use in any area you need. You can successfully share them in social media, blogs, mass media, reports, publish on websites, illustrate economic articles in specialized magazines. They are useful for economics specialists, marketing experts, politics, business analysts, journalists and bloggers focusing on economics, educators and students studying economics.
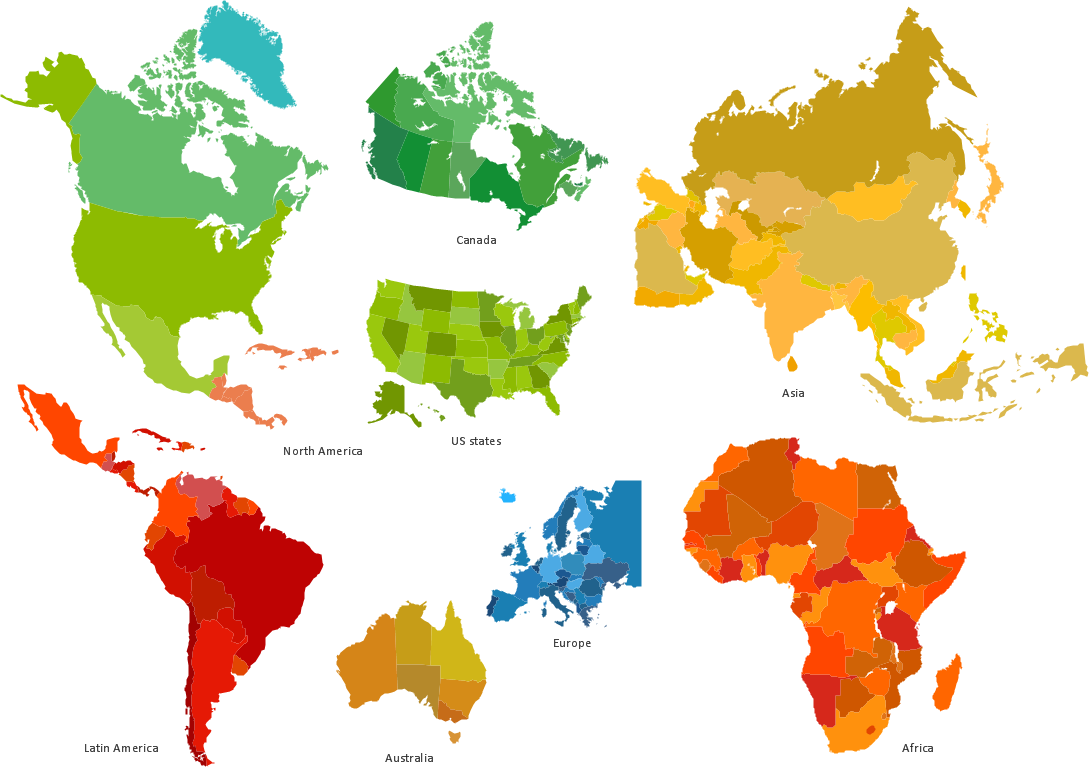
Example 1. Best Infographics Easy in ConceptDraw DIAGRAM
Being used on websites, in blogs, on social media, and more the infographics allow presenting information in a compelling fashion. The attractive, colorful, and comprehensive infographics encourage visitors to spend time on your site. This increases your rating, growths purchases if it is a business site, and correspondingly increases profit.
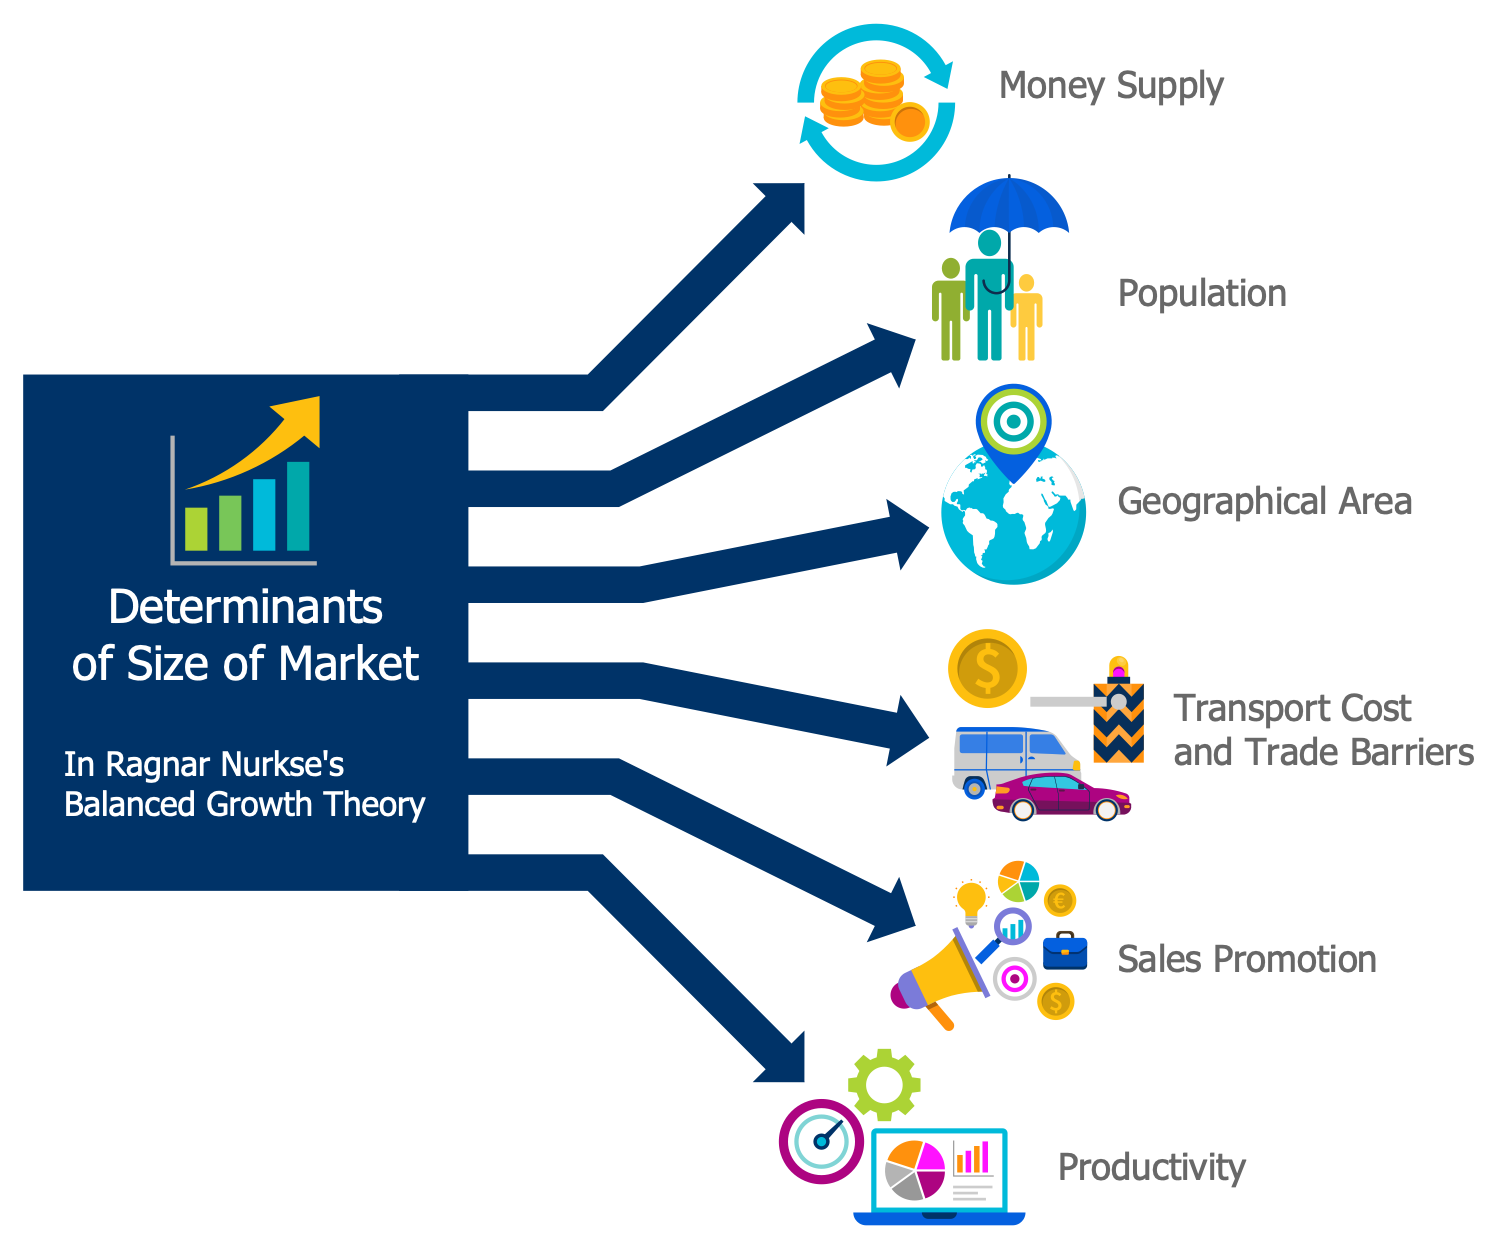
The special standardized symbols, icons, and pictograms are widely used in all economic-related areas. They allow making the infographics visual and easily comprehensible for all stakeholders. The Economy Infographics solution provides 6 libraries with 300+ pre-made vector design elements, icons, clipart, and symbols applied in economics. The libraries include symbols related with economy, digital economy, heavy industry, light industry, raw materials, and services.

Example 2. Sustainable Development
The clipart, infographics samples and examples included to the solution libraries allow quick and simple designing your own infographics, illustrations, presentations, and diagrams in economics. Bright colors effectively attract readers. That's why bravely use colorful pictograms and clipart included in the solution libraries.

Example 3. 7 Ps of Services Marketing
The infographics you see on this page were created in ConceptDraw DIAGRAM software using the Economy Infographics Solution and its pre-made pictograms and clipart. They successfully demonstrate the solution's capabilities and professional results you can achieve. An experienced user spent 10-15 minutes creating each of these samples.
Use the powerful tools of the Economy Infographics Solution for ConceptDraw DIAGRAM software to create your own infographics and diagrams of any complexity fast and easy, and then successfully use them in your work and personal activity.
All source documents are vector graphic documents. They are available for reviewing, modifying, or converting to a variety of formats (PDF file, MS PowerPoint, MS Visio, and many more graphic formats) from the ConceptDraw STORE. The Economy Infographics Solution is available for all ConceptDraw DIAGRAM users.