Made with
ConceptDraw
DIAGRAM 18

Analog Electronics

Analog electronics is a branch of electrical engineering and a kind of electronic system that deals with continuously variable signals. Analog messages are sent as signals of varying frequency. The proportional relationship exists between a signal and a voltage or current in an analog circuit.

Everything in the real world is analog and analog information surrounds us everywhere. Analog electronics are used to convert analog signals into digital ones that are easily proceed and stored, they also amplify, attenuate, isolate, modify, and even distort signals. These include various analog devices, mechanical and electronic, which convey analog information (sounds, visuals, etc.), radio and audio equipment. Analog electronic devices store information on physical mediums like tapes, films, etc.

Analog methods used in analog electronics allow the equipment to handle information that continuously changes like the voltage, current, and waves. Usually, they operate with time-varying quantities. Analog electronics help to measure, track and adjust numerous parameters including pressure, speed, atmospheric humidity, and many more.

Digital electronics is also widespread and highly used, but analog electronics are a necessity and play an important role in electronic development. Moreover, any time when digital electronics interact with the real world, analog electronics are indispensable to provide this interaction.

Analog electronics provides high accuracy and speed in applications when conversion to and from the digital format is necessary. Analog electronics also has low sensitivity to interference and EMC immunity and is applicable in cases of low power. It is a great advantage because electromagnetic fields and other factors can usually cause interference and affect the reliability and functionality of electronics.

Analog Electronics - Current Resonant CCFL Inverter Schematic

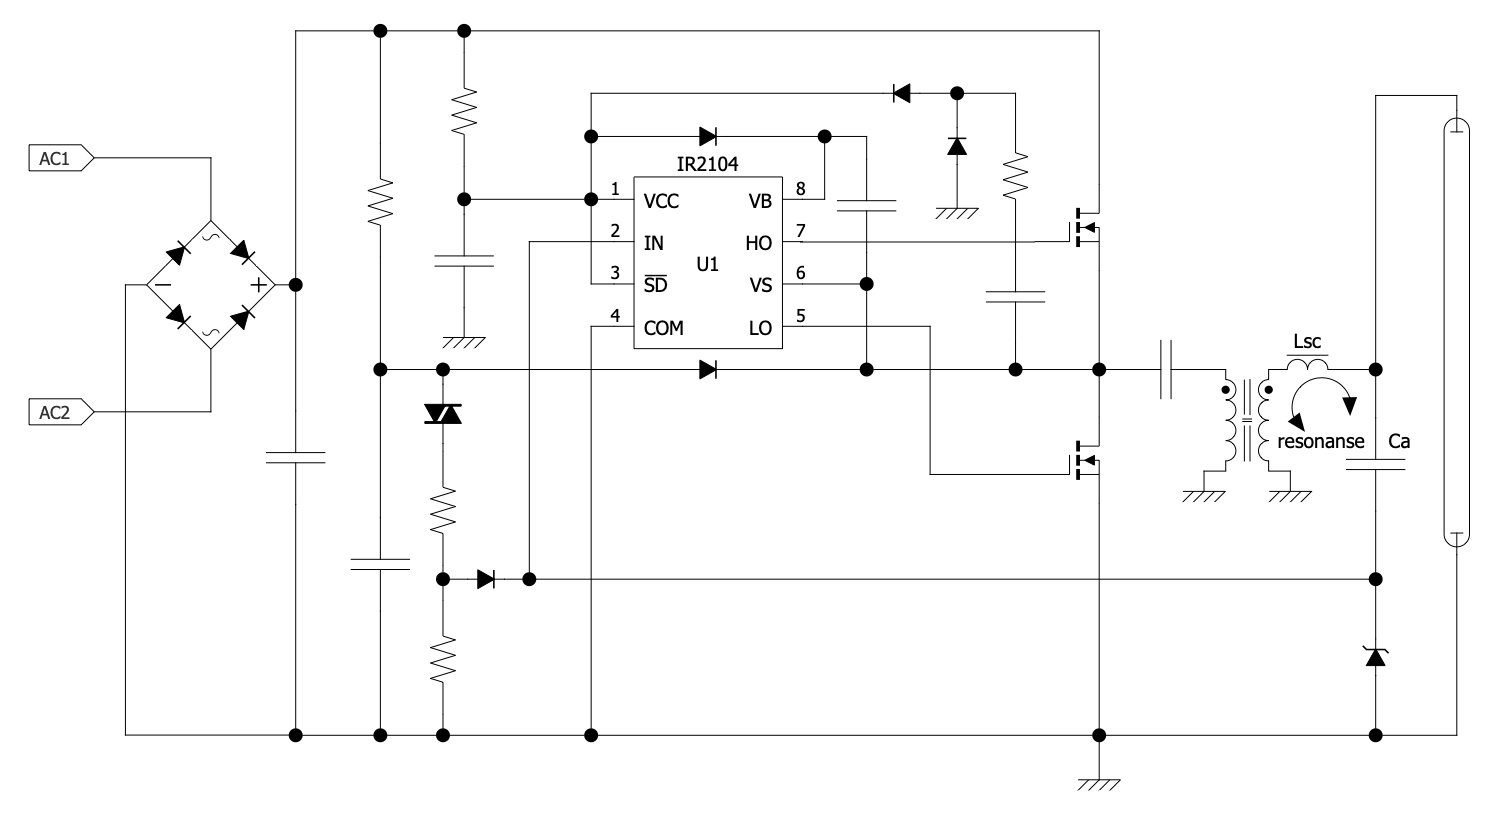
Example 1. Analog Electronics - Current Resonant CCFL Inverter Schematic

There are two large groups of analog circuits: passive and active. Currently, completely analog circuits are a rarity and often include also digital or microprocessor techniques to improve performance. The combination of analog and digital technologies, microcontrollers, and other components often is used to ensure flexibility and develop a first-rate end product relevant to all safety requirements.

Analog circuits include simple and complex combinations of basic electronic components and realize various actions with signals. Smart choice of concept and components, and precisely created electronic circuit schematic provide development of high-quality products, keep down production costs and final cost of the product. Therefore precise schematics are created and then used to develop robust, reliable, safe, and efficient analog circuits and analog electronics.

Fluorescent Lamp Smart Starter Schematic

Example 2. Analog Electronics Solution Design Elements

As a rule, it is quite difficult to create analog circuits, meanwhile ConceptDraw DIAGRAM strives to easier their development. The special Analog Electronics solution included in ConceptDraw STORE offers a large collection of professional drawing tools, pre-made vector design elements — transistors, diodes, crystals, electrical signal connectors, and many more, and professionally designed samples of analog circuits and analog electronics designs. All these tools are useful to create your own analog electronics diagrams in a few minutes.

Fluorescent Lamp Smart Starter Schematic

Example 3. Fluorescent Lamp Smart Starter Schematic

The Analog Electronics samples you see on this page were created in ConceptDraw DIAGRAM software using the drawing tools of the Analog Electronics Solution. These examples successfully demonstrate the solution's capabilities and professional results you can achieve using it. An experienced user spent 10-15 minutes creating each of these samples.

Use the drawing tools of the Analog Electronics solution to design your own Analog Electronics Infographics quick, easy, and effective.

All source documents are vector graphic documents. They are available for reviewing, modifying, or converting to a variety of formats (PDF file, MS PowerPoint, MS Visio, and many other graphic formats) from the ConceptDraw STORE. The Analog Electronics Solution is available for ConceptDraw DIAGRAM users.


TEN RELATED HOW TO's:
Accounting is a cornerstone of any business, it’s basement. If you want to have a visual representation of your finance management, use audit flowchart symbols to document the money flow. Although some would say that accounting is boring, it is very a responsible duty. The audit flowchart symbols is supplied with ConceptDraw Audit Flowcharts solution as a vector objects library. Together with Conceptdraw Drawing capabilities it forms the helpful tool for audit process planning and setting the steps of audit by designing audit flow charts. Audit Flow charts are used to organize fiscal information tracking process as well as in accounting, finance and investment management.Audit Flowchart Symbols
Picture: Audit Flowchart Symbols
Related Solution:
Data structure diagram (DSD) is intended for description of conceptual models of data (concepts and connections between them) in the graphic format for more obviousness. Data structure diagram includes entities description, connections between them and obligatory conditions and requirements which connect them. Create Data structure diagram with ConceptDraw DIAGRAM.Data structure diagram with ConceptDraw DIAGRAM
Picture: Data structure diagram with ConceptDraw DIAGRAM
Diagramming is an astonishing way to visualize business processes. The list of the most common business process flowchart symbols is quite long starting from basic flowcharts, continuing with SIPOC diagrams. Business process modeling was never easier than now, with special ConceptDraw Business Process Mapping solution. To carry out all professional standard requirements for business processes mapping, it is necessarily to follow the special graphical notations. ConceptDraw Business Process Mapping solution offers an exhaustive suite of tools to aid business process mapping. There are three vector libraries SIPOC Diagrams, Business Process Flowcharts, and Swim Lanes that contains totally more than 50 symbols of standard BPM notations. This is all that professionals need to effectively evaluate and manage quality in business processes.Business Process Flowchart Symbols *
Picture: Business Process Flowchart Symbols
Related Solution:
If you need to describe some process, diagramming is a perfect tool for almost any imaginable purpose. The set of the most commonly used flow charts symbols is quite wide and includes symbols for operations, processes, data inputs and outputs. You can see the full list of all the symbols used for flowcharting in Flowcharts solution from Diagrams area in ConceptDraw Solution Park. A flow chart is often used for visual representation of a sequential process flow. The flowchart approach to any process is to divide it into some sequential actions. What makes a flow chart so popular and clear to make out is the set of standard flowchart symbols that has the same reading independently from processes described with their applying. The current drawing represents the vector library containing the pack of standard flowchart symbols. This library is supplied with ConceptDraw Flowcharts solution.Flow Chart Symbols
Picture: Flow Chart Symbols
Related Solution:
A flowchart is a simple but very functional tool when it comes to understanding a workflow or to removing unnecessary stages from a process. When drawing flowcharts, keep in mind that there are four common types of flowcharts, like document flowcharts and data flowcharts that show control over a data or document flow over a system. To show controls on a physical level, use system flowcharts. In addition, to show controls in a program, you can draw a program flowchart. This flowchart diagram represents the piece of an article editing process, that involves the author and editor. It was created using the Basic Flowchart notation that consists from the basic flowchart symbols. The start and the end of the process are indicated with "Terminator" symbols. The "Process" symbols show the action steps consisting from making edits and searching for a compromise, when the author does not agree with the suggestions of the editor. The "Process" symbol is the general symbol in process flowcharts. The "Decision" symbol indicates a branching in the process flow. There are two branches indicated by a Decision shape in the current flowchart (Yes/No, Disagree/Agree). This basic flowchart can be used as a repeating unit in the workflow diagram describing the working process of some editorial office.Types of Flowcharts *
Picture: Types of Flowcharts
Related Solution:
Use ConceptDraw DIAGRAM diagramming and business graphics software to draw your own flowcharts of computer algorithms.Process Flow app for macOS *
Picture: Process Flow app for macOS
Related Solution:
The ConceptDraw Flowchart component includes a set of samples and templates. This geathered as flowchart maker toolbox which focused on drawing flowcharts of any industry standards.Flowchart Components
Picture: Flowchart Components
Related Solution:
Data flow diagrams are the graphical tool, used in the visualization of data flow of some data processing systems. It is the valuable process modeling tool. Also designing DFD is the important component of the initial part of any information system development project. The standard symbols are used to represent the interaction of a system components and how various kinds of components influence on data flow. The ConceptDraw Data Flow Diagrams solution is design to assist professional software engineers in making DFDs according to Gane and Sarson, and Yourdon and Coad notations. Do you imagine yourself as a successful IT specialist? To your mind, they all use data flow diagram examples to learn and to get inspired. Aren’t you still with us?Data Flow Diagram Examples *
Picture: Data Flow Diagram Examples
Related Solution:
ConceptDraw DIAGRAM is a world-class diagramming platform that lets you display, communicate, and present dynamically. It′s powerful enough to draw everything from basic flowcharts to complex engineering schematics. Video tutorials on ConceptDraw products. Try it today!Business  Process Mapping — How to Map a Work Process *
Picture: Business Process Mapping — How to Map a Work Process
Related Solutions:
Event-Driven Process Chain Diagrams for improvement throughout an organisation. ConceptDraw DIAGRAM - software that reduces the time needed to create a business process model.Graphical Symbols to use in EPC diagrams *
Picture: Graphical Symbols to use in EPC diagrams
Related Solution:
ConceptDraw
DIAGRAM 18