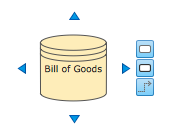
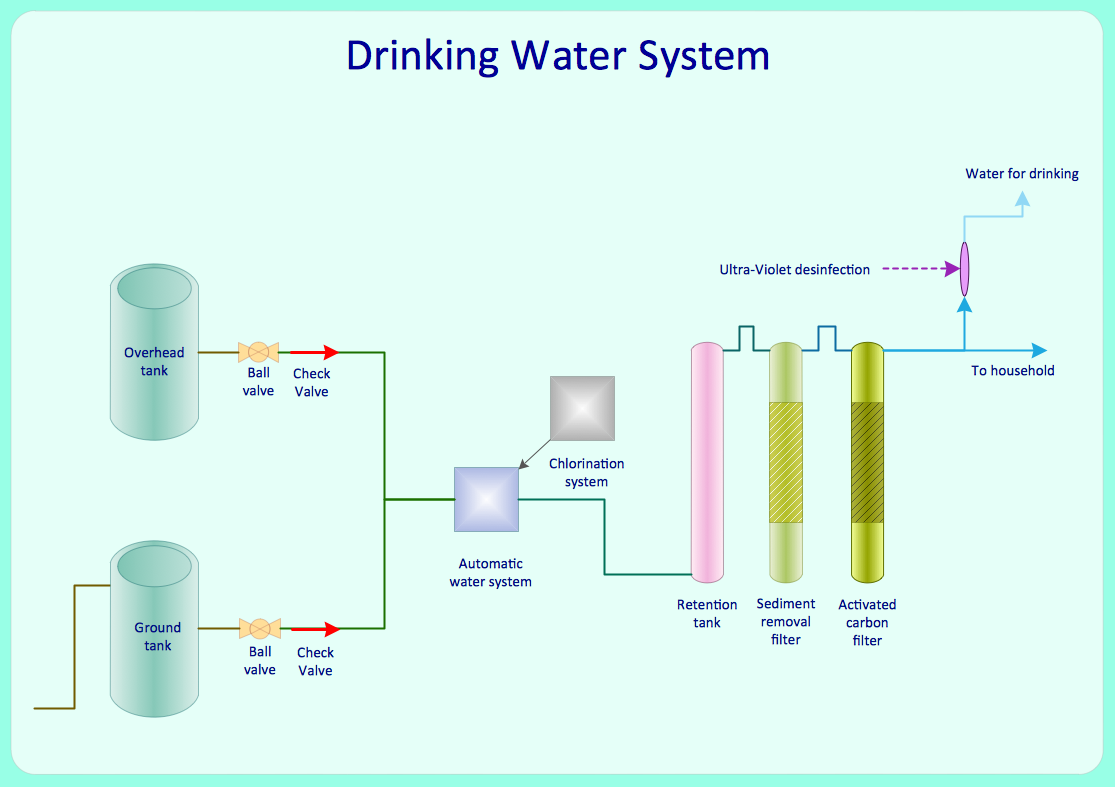
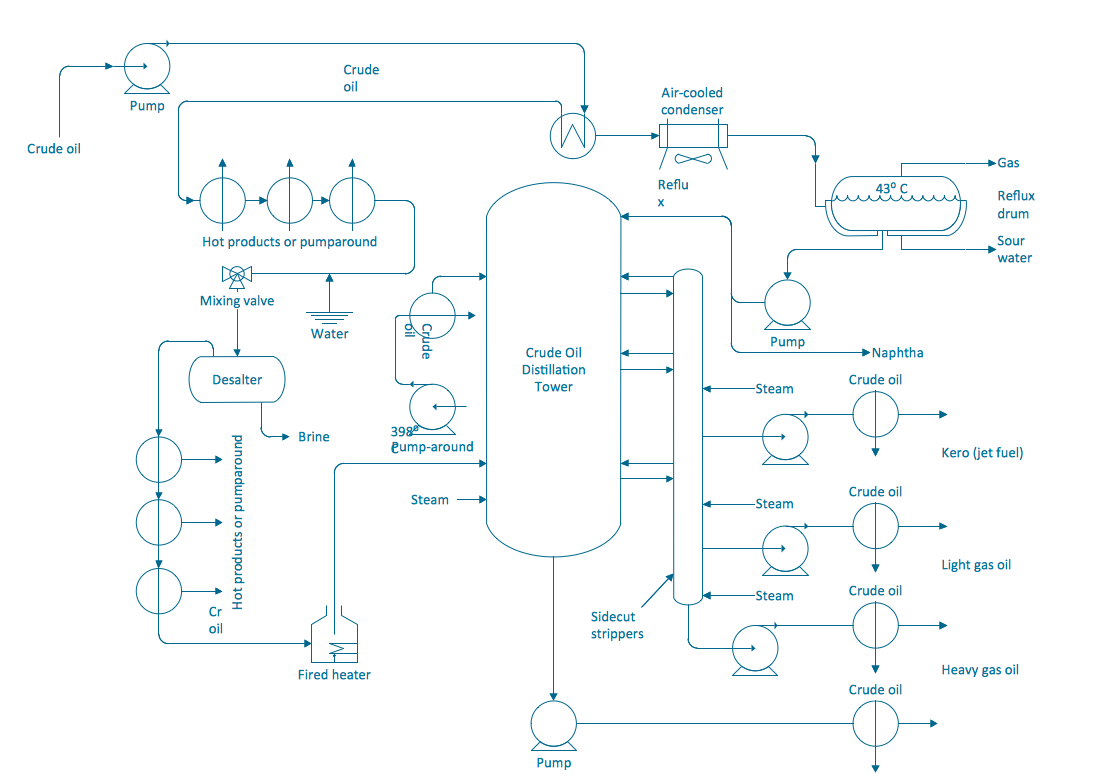
 Process and Instrument Diagram
The Benefits for Process Flowchart
The process flow chart provides a visual representation of the steps in a process. Flow charts are also referred to as process mapping or flow diagrams. ConceptDraw DIAGRAM is a perfect process flowchart software with rich flow chart templates and flow chart symbols you can create professional flow charts quickly and easily. Constructing a flow chart is often one of the first activities of a process improvement effort, because of the following benefits:
- Make process flowcharts
- Give everyone a clear understanding of the process
- Help to identify non-value-added operations
- Facilitate teamwork and communication
- Keep everyone on the same page
- Design a flow charts
- Flowchart construction etc.
Process Flowchart Drawing Guide-lines
There is no one right way to develop a flowchart, but the following guide-lines provide a general structure to follow, whether it's of the overall course navigational process, or at the hand-off phase to the various team members to develop more detailed treatment.
- Start with a simple one-line description or
title of the process being flowcharted , e.g., "How to..."
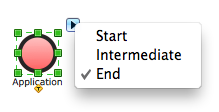
- Using a top-down hierarchy, start with a
terminal symbol, naming this trigger event, e.g., "User accesses course
database..."
- Connect each successive action step in the
logical sequence of events.
- Reference detailed information through
annotations or connectors.
- Follow the process through to completion,
denoted by a labeled end terminal symbol, e.g., "exit course."
A well-developed functional flowchart created in the design phase can save hours of wasted manpower time by ensuring the structure, sequencing and branching decision points in a computer based instructional program, support the course goals and objectives before
development.
Whether you are the sole creator wearing many hats, or one of many on the development team, sharing a common visual language will guide the project through its many iterations and development phases throughout the instructional design process.
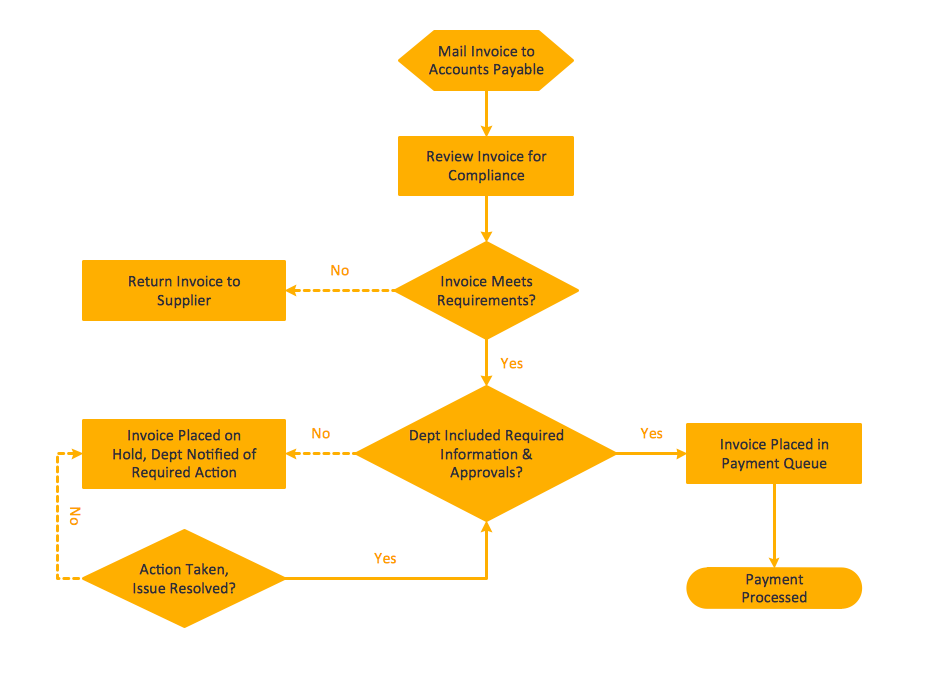
-->
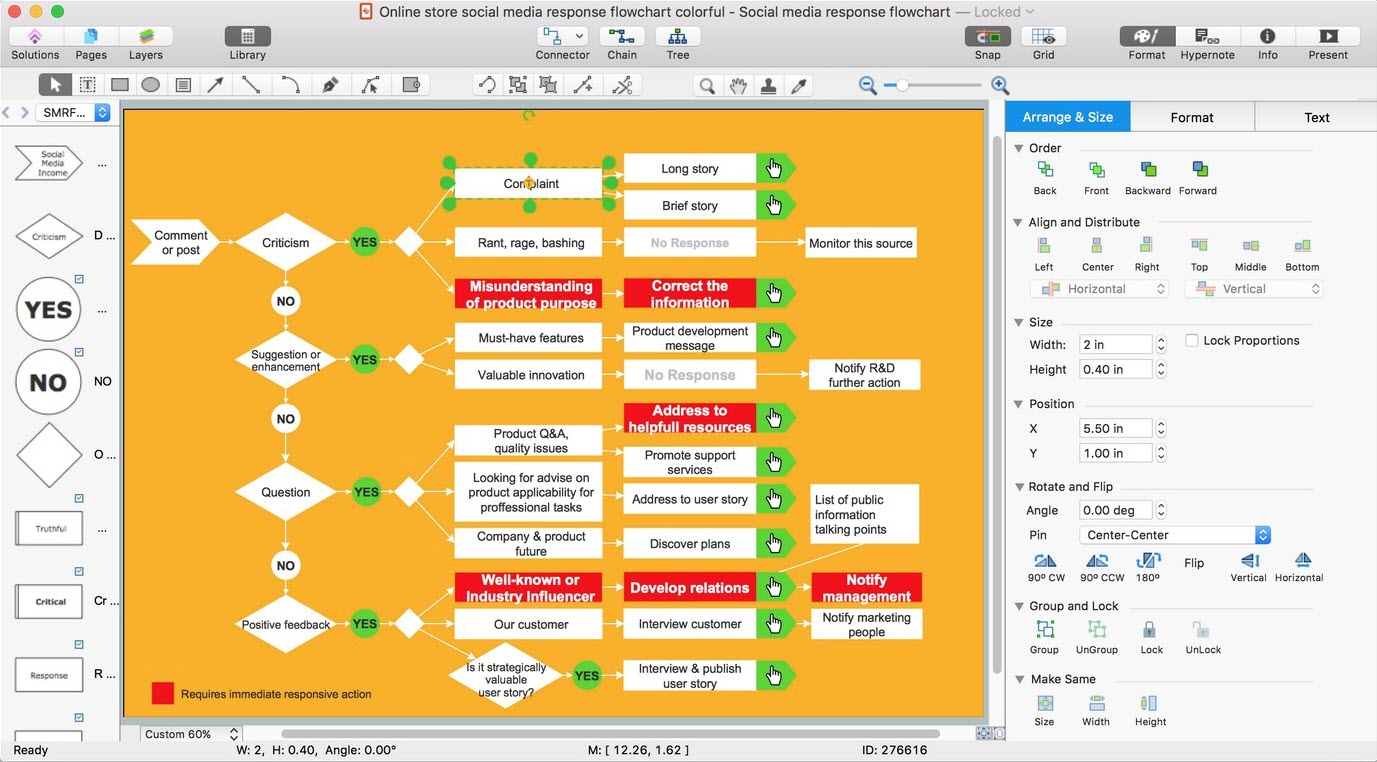
Pic. 1. Diagram Software
Examples of Diagram
ConceptDraw DIAGRAM diagram designer provides a huge collection of examples for different types of diagrams that will help you create a diagram faster using any of them as the base. Be sure that your own diagrams designed in ConceptDraw DIAGRAM diagram creator will look professional and attractive.

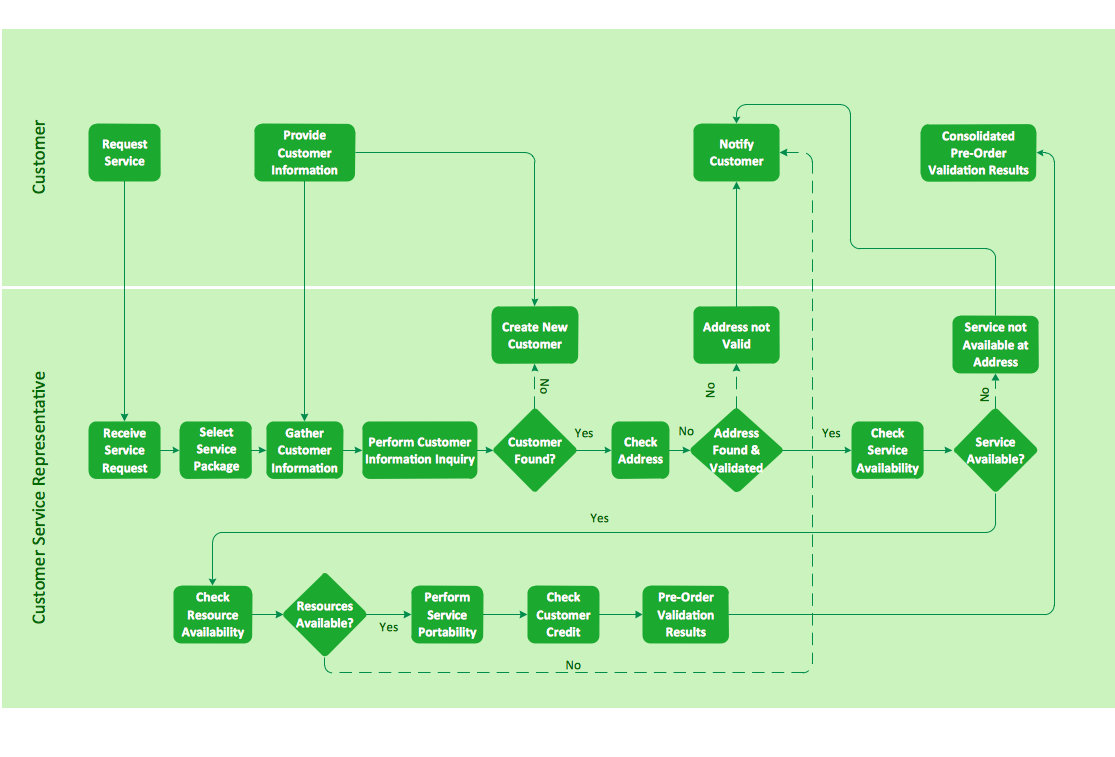
Pic. 2. Diagram Designer — Tokyo Tube Map

Pic. 3. Diagram Maker — ERD
Use a variety of drawing tools, smart connectors and shape libraries to create flowcharts of complex processes, procedures and information exchange. Define and document basic work and data flows, financial, production and quality management processes to increase efficiency of you business. Create process flowcharts, process flow Models, data flow diagrams, basic Flowcharts, IDEF0 flowcharts and SDL diagrams and a lot more with a perfect business flowchart tool ConceptDraw DIAGRAM .
The Benefits for Diagram Software
- With large quantity of ready-to-use vector objects from the ConceptDraw DIAGRAM libraries nothing could be easier to draw various types of diagrams in a few minutes.
- The great number of predesigned templates and samples from the ConceptDraw DIAGRAM solutions give you the good start for your own diagrams.
- ConceptDraw DIAGRAM diagram maker supports dynamic presentations with Live Object technology for displaying external data.
- All ConceptDraw DIAGRAM documents are vector graphic files and are available for reviewing, modifying, and converting to a variety of formats: image, HTML, PDF file, MS PowerPoint Presentation, Adobe Flash, MS Visio.
ConceptDraw MINDMAP
Tool for Mind Mapping and Brainstorming
ConceptDraw MINDMAP is designed to help you manage your ideas effectively. You can use ConceptDraw MINDMAP for process construction, mind mapping and brainstorming. Rich import and export capabilities are useful for sharing maps with colleagues and publishing content. Rich clipart galleries and extended drawing capabilities make your maps more informative and easier to understand.
Mind Map and Brainstorming Software
ConceptDraw MINDMAP offers a set of tools for generating, structuring, organizing and visualizing ideas and data. It is effectively used for planning, problem solving, decision making, creative and critical thinking, organization, presentations, team brainstorming, knowledge management, studying and learning with the help of clear visual mind maps.

Pic. 4. Mind Map and Brainstorming Software
Examples of Mind Map and Brainstorming
ConceptDraw MINDMAP provides a large quantity of examples of professionally designed mind maps on the different themes, for various situations that can be successfully used on the presentations, conferences, in blog posts, on websites.

Pic. 5. Mind Map — Pen Drawing

Pic. 6. Mind Map
The Benefits for Mind Map and Brainstorming Software
- ConceptDraw MINDMAP is effective for designing the mind maps, brainstorming, idea generating, creative and lateral thinking, creativity and problem solving.
- The wide set of tools makes ConceptDraw MINDMAP ideal for team and personal work in Business, Marketing and Project Management.
- The libraries with large quantity of vector objects help to illustrate your mind maps and to make them bright, visual and comprehensible.
- Using the View Navigator tool you can create presentations from a mind map: a mind map diagram maker gives you the possibility to simply select the map parts you want to present, sequence your slides, and preview the presentation.
- ConceptDraw MINDMAP allows you to input your data from many different file formats and to output to wide variety of applications, such as Microsoft PowerPoint, Microsoft Word, MS Excel, Mindjet MindManager, save as image, HTML, PDF file.
ConceptDraw PROJECT
Powerful Project Management Application
ConceptDraw PROJECT is a comprehensive tool for project planning and resource management. ConceptDraw PROJECT gives you visibility into all essential elements involved in your project and gives you the control you need to oversee resources and budget. ConceptDraw PROJECT is easy to learn and use.
Project Management Software
ConceptDraw PROJECT provides an extensive set of tools to help project managers to plan and monitor project development and resource allocation. ConceptDraw PROJECT enables you graphically represent the tasks of your project in the form of Gantt Chart, build project dashboards, various one-click reports and easily view the project progress.

Pic. 7. Project Management Software
Examples of Project Management
ConceptDraw PROJECT provides a set of project management examples, of Gantt Charts, Multiproject Dashboards, reports.

Pic. 8. Gantt Chart

Pic. 9. Multiproject Dashboard
The Benefits for Project Management Software
- ConceptDraw PROJECT is an effective tool with powerful functionality which is ideal for planning, scheduling and monitoring project development, allocation of budget and resources.
- ConceptDraw PROJECT enables you to manage single and multi-projects, create visual project dashboards and diagrams, generate various kinds of reports with one click.
- ConceptDraw PROJECT provides wide capabilities of importing and exporting in various formats: Microsoft Project, ConceptDraw MINDMAP, Mindjet MindManager, PDF file.
 Basic Flowchart
  Business Process Modeling Notation
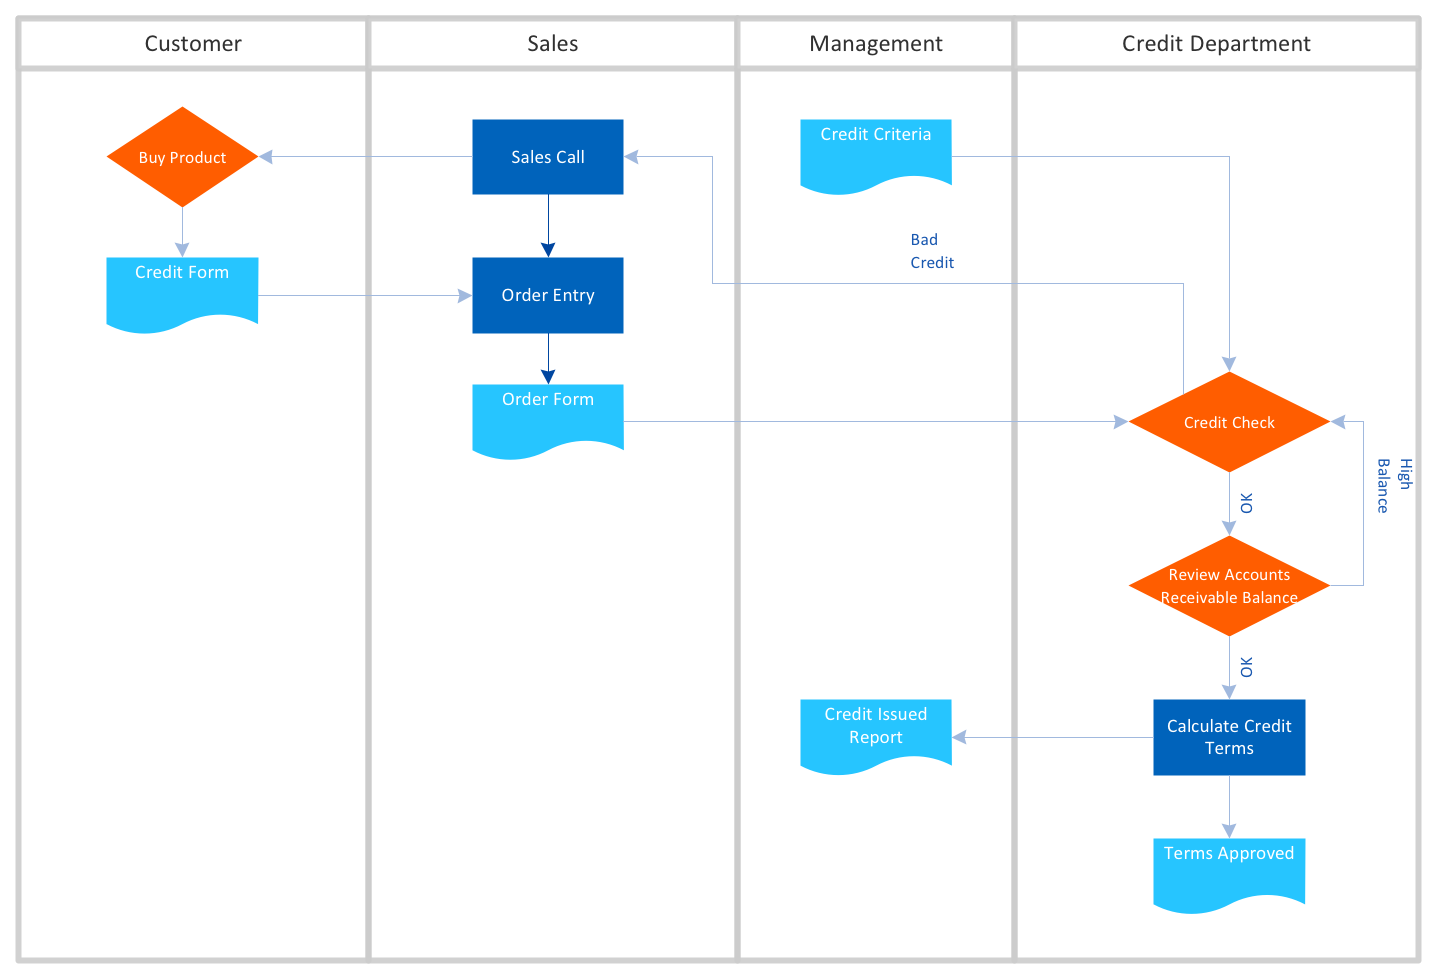
 Cross Functional Horizontal
 Cross Functional Vertical
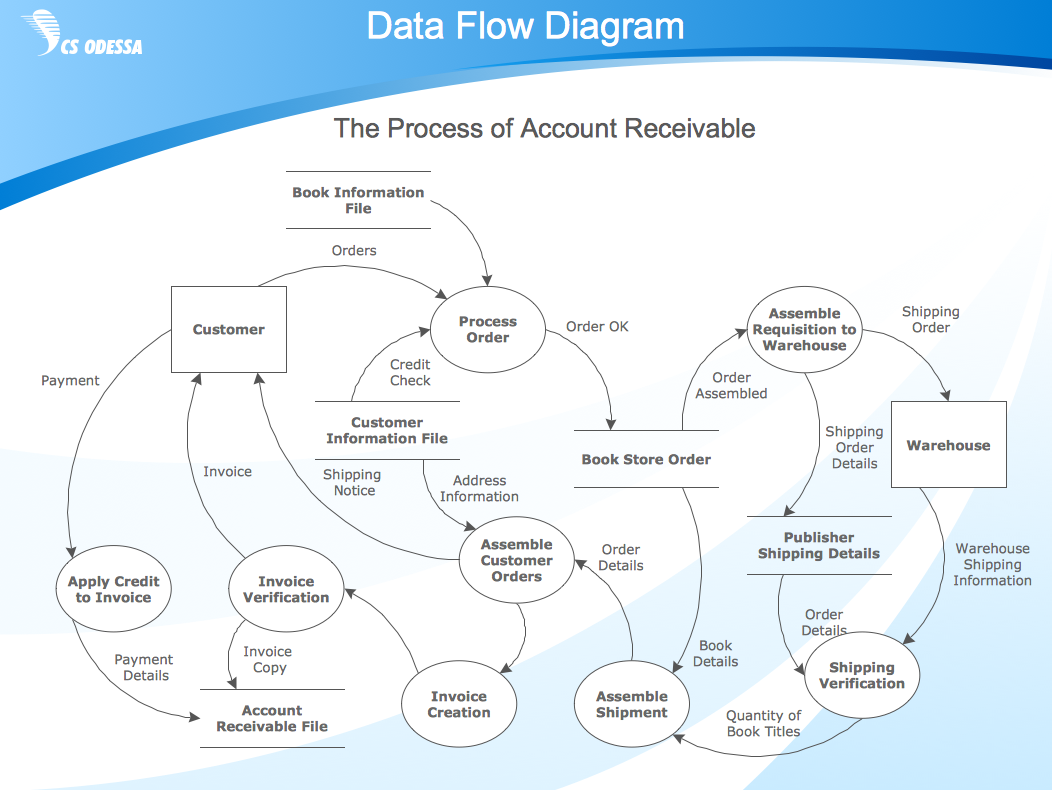 Data Flow Diagram
 IDEF Diagram
 Hidhlight Flowchart
 List and process
 Work Flow Diagram