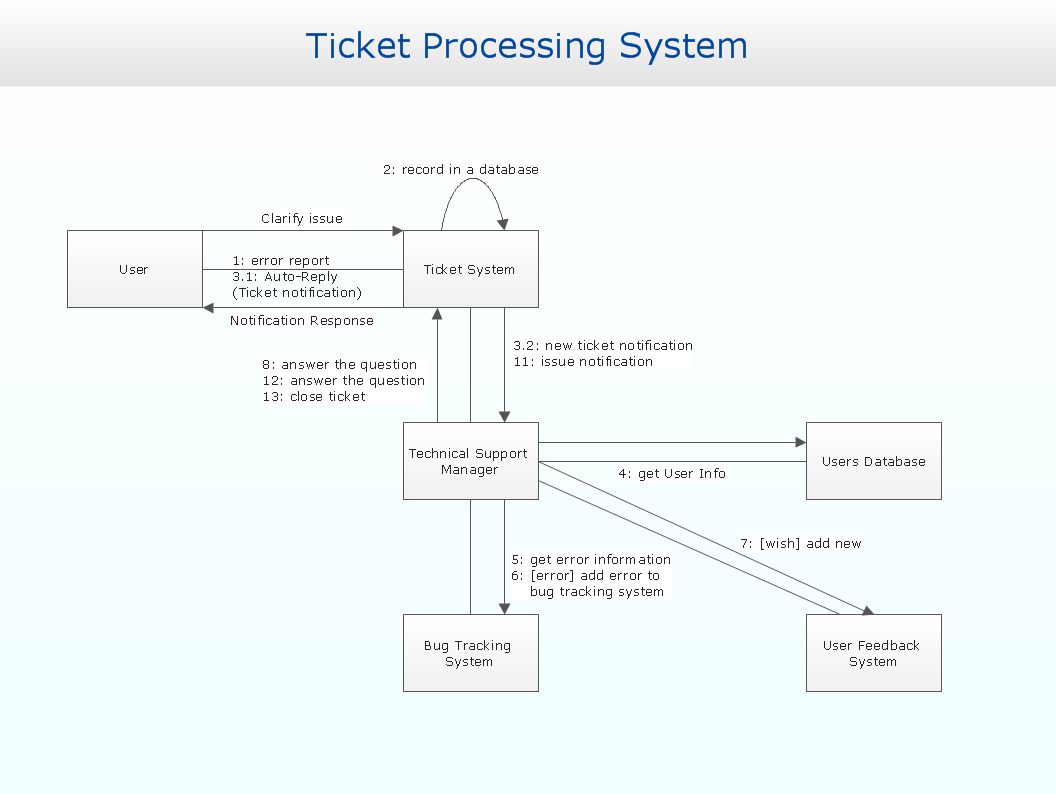
Diagramming Software for Design UML Communication Diagrams
UML Communication Diagram depicts the interactions between objects or parts in terms of sequenced messages and describes both the static structure and dynamic behavior of a system.
Pyramid Diagram
Zooko's triangle is a diagram named after Zooko Wilcox-O'Hearn which sets out suspected tradeoffs for a system for giving names to participants in a network protocol.HelpDesk
How to Draw a Circular Arrows Diagram Using ConceptDraw PRO
The cyclic recurrence is a fundamental property of multiple systems. The cycle is a process which consists from elements (phases, stages, stages) following each other. Many processes in astronomy, biology, chemistry, physics, mathematics, etc. have a cycle properties. It is also widely used in information technologies and marketing analysis. Graphical representation of cyclic processes can have many forms. It can be a circle, parabola, hyperbola, ellipse and others. A Circular Arrows Diagram is used as one of the statistical charts in the business, mass media and marketing. ConceptDraw PRO provides its users tools for making easy drawing Circular Arrows Diagrams.Marketing Analysis Diagram
An example of marketing analysis diagram, can be used to analyse product market and define marketing strategy.Pyramid Diagram
Pyramid chart example is included in the Pyramid Diagrams solution from Marketing area of ConceptDraw Solution Park.Flowchart Marketing Process. Flowchart Examples
This sample shows the Flowchart that displays the layout and work flow of the cloud marketing platform. This diagram has a style of the marketing brochure. This style displays the central product that is related to the other issues.Using the ready-to-use predesigned objects, samples and templates from the Flowcharts Solution for ConceptDraw PRO you can create your own professional looking Flowchart Diagrams quick and easy.
Diagram of a Pyramid
Pyramid diagram is a convenient way of representing data hierarchical structure and visualization relationships between hierarchy levels. You need create the diagram of a pyramid? ConceptDraw diagramming and vector drawing software supplied with Pyramid Diagrams Solution from the Marketing Area of ConceptDraw Solution Park is the best tool for drawing attractive and successful diagram of a pyramid.Communication Diagram UML2.0 / Collaboration UML1.x
UML Communication diagramming software with rich examples and template. ConceptDraw is ideal for software designers and software developers who need to draw UML Communication Diagrams.
Best Diagramming
Need to draw a diagram, process chart, flowchart, organizational chart, graphic design? ConceptDraw can help you to make professional graphic documents quickly.
Business Productivity - Marketing
To support you in your tasks you can use the power of ConceptDraw PRO providingintelligent vector graphics that are useful for marketing diagramming and
ConceptDraw MINDMAP for key marketing mind maps.
UML Use Case Diagram Example Social Networking Sites Project
UML Diagrams Social Networking Sites Project. This sample was created in ConceptDraw PRO diagramming and vector drawing software using the UML Use Case Diagram library of the Rapid UML Solution from the Software Development area of ConceptDraw Solution Park.This sample shows the Facebook Socio-health system and is used at the projection and creating of the social networking sites.
Diagramming Software for Design UML Collaboration Diagrams
ConceptDraw helps you to start designing your own UML Collaboration Diagrams with examples and templates.
Marketing Plan Infographic
You need design the Marketing Plan Infographic and dream to find the useful tools to draw it easier, quickly and effectively? ConceptDraw PRO offers the unique Marketing Infographics Solution from the Business Infographics Area that will help you!UML Diagram Editor
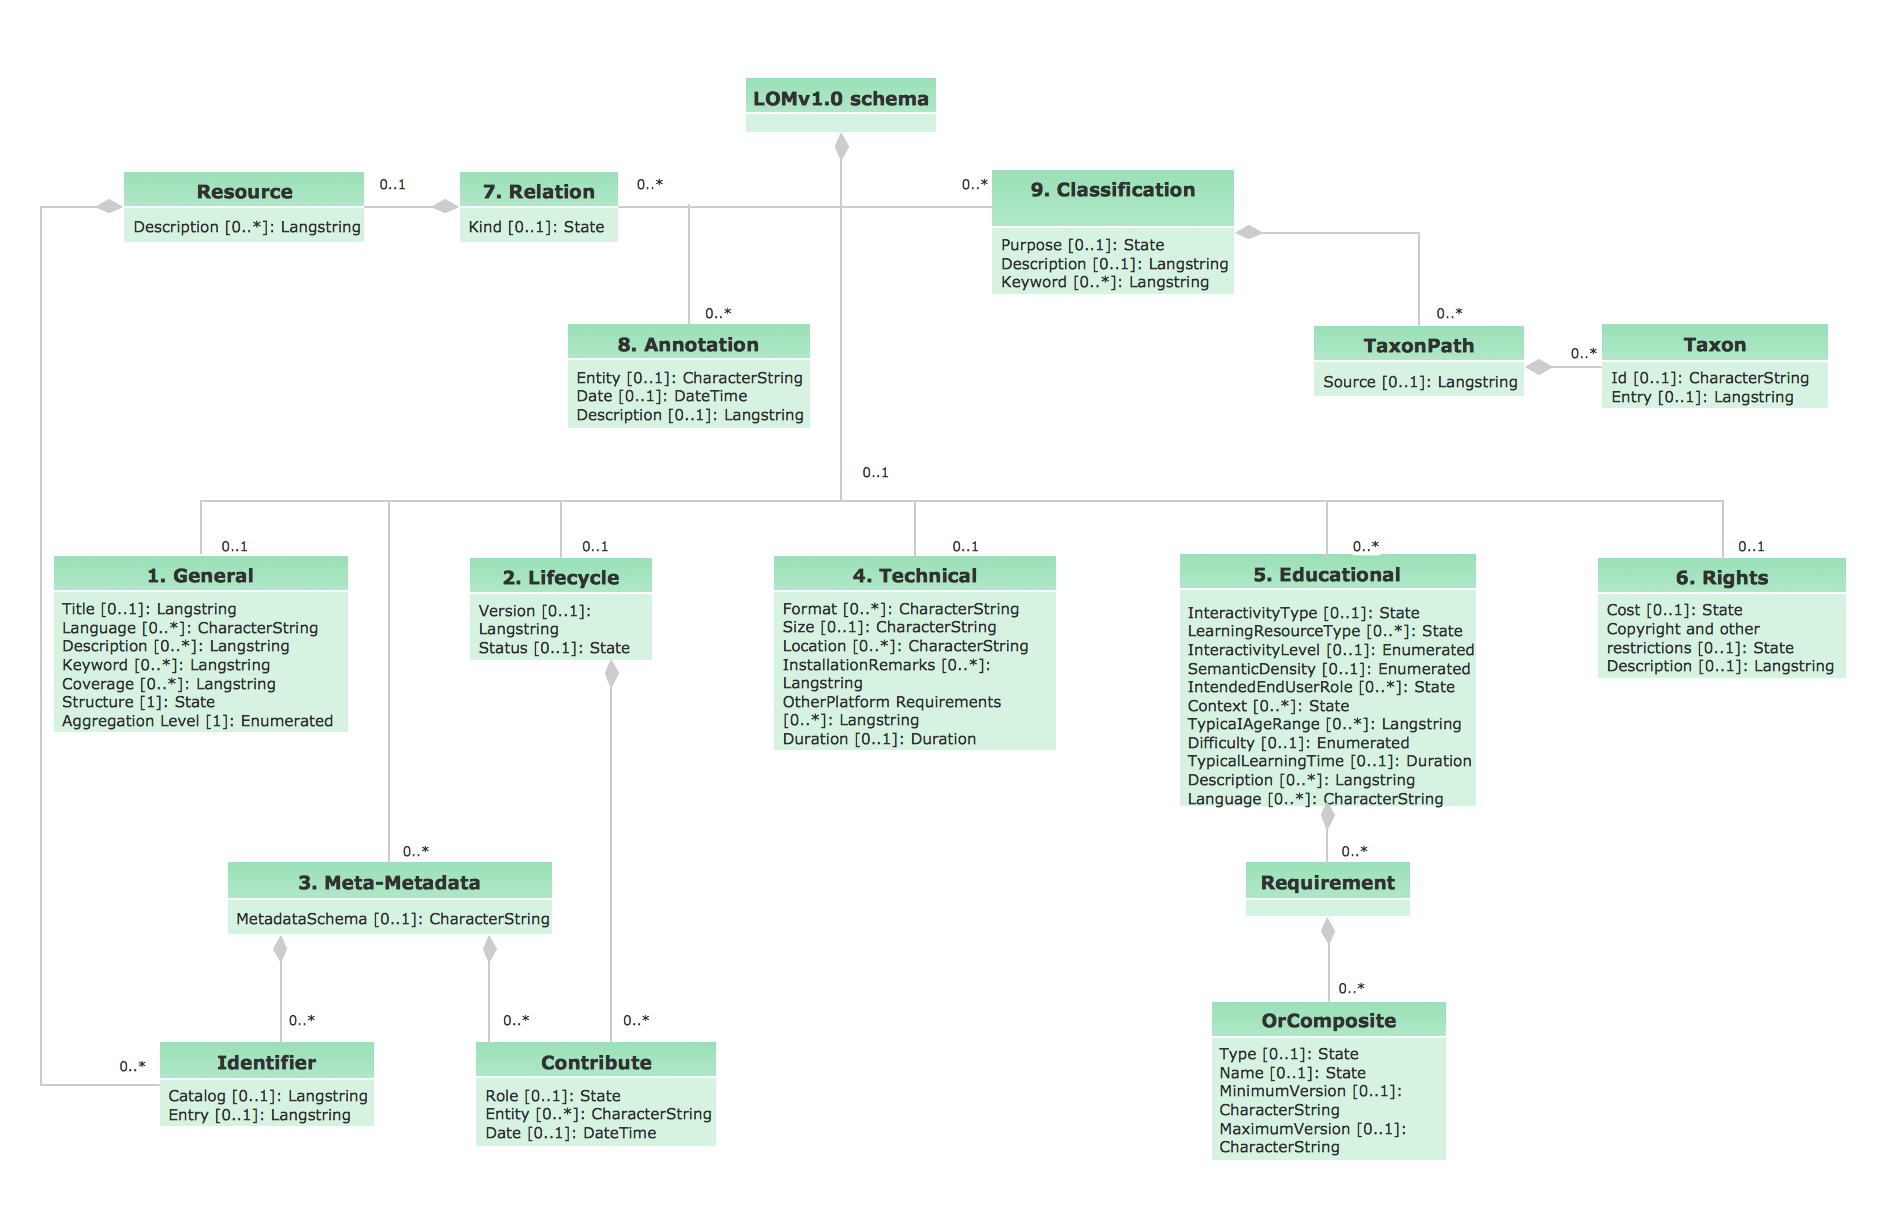
This sample shows the UML Class Diagram of Learning Object Metadata (LOM) base schema. The classes represented as boxes with attributes and are connected with associations. You can see the composition associations on this diagram. The associations are indicated with the multiplicities 0..1, 0..*. This sample can be used in electrical and electronics engineering.Pyramid Diagram
The purchase or purchasing funnel is a consumer focused marketing model which illustrates the theoretical customer journey towards the purchase of a product or service.- Communication Diagram In Marketing
- Marketing Communication Diagram
- Diagrams Of Marketing Communication Models
- Pyramid Diagram | Pyramid Diagram | Flowchart Marketing Process ...
- Diagram Showing Marketing Communication Process
- Marketing Communication Process Diagram
- Examples Of Communication Process Diagram
- Marketing Communication Triangle Diagrams
- Diagram On Marketing Communication Mix
- What Is Marketing Communication Process With Diagrams
- Explain Marketing Communications With The Help Of Chart
- What Is Marketing Communication And Draw The It Diagrams
- Media Scheduling With Diagram Marketing Communications
- Diagram Of Marketing Communication Flow
- Use A Diagram To Describe The Marketing Communication Process
- Marketing Communication Process Flow
- Explain Marketing Communication With Flow Chart
- Marketing Communications Process Flow Chart
- Process Of Market Communication And Illustrate With Diagram
- Diagrams Of Marketing Communication In Service
- ERD | Entity Relationship Diagrams, ERD Software for Mac and Win
- Flowchart | Basic Flowchart Symbols and Meaning
- Flowchart | Flowchart Design - Symbols, Shapes, Stencils and Icons
- Flowchart | Flow Chart Symbols
- Electrical | Electrical Drawing - Wiring and Circuits Schematics
- Flowchart | Common Flowchart Symbols
- Flowchart | Common Flowchart Symbols


