Flowchart Examples and Templates

Accounting Flowchart Symbols

Basic Flowchart Symbols and Meaning


Cross-Functional Flowchart

Use cross-functional flowcharts to show the relationship between a business process and the functional units (such as departments) responsible for that process. To create it use the best flowchart maker of ConceptDraw PRO.

Why flowchart is important to accounting information system?

Business Process Flow Diagram

ConceptDraw PRO extended with Business Process Workflow Diagrams solution from the Business Processes area of ConceptDraw Solution Park is a powerful software which lets easy design Business Process Flow Diagram of any complexity.
How Do You Make An Accounting Process Flowchart?

Tips, Methods and Symbols on How to Create Flowcharts for an Accounting Information System.
Rainfall Bar Chart

This sample was created in ConceptDraw PRO diagramming and vector drawing software using the Bar Graphs Solution from the Graphs and Charts area of ConceptDraw Solution Park.
Why is it important to have a formal purchasing process?

Waterfall Bar Chart

Column Chart Template

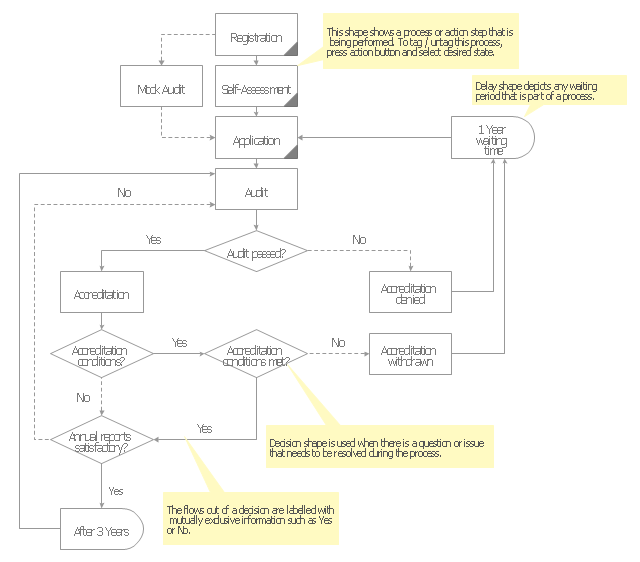
Audit Process Flowchart. Audit Flowchart

Accounting Flowchart: Purchasing, Receiving, Payable and Payment

Audit flowcharts (audit diagrams) visualize business processes as financial transactions and inventory management. They are used to develop, analyse and present the audit processes.
"Auditing is a vital part of accounting. Traditionally, audits were mainly associated with gaining information about financial systems and the financial records of a company or a business.
Financial audits are performed to ascertain the validity and reliability of information, as well as to provide an assessment of a system's internal control. The goal of an audit is to express an opinion of the person / organization / system (etc.) in question, under evaluation based on work done on a test basis.
Due to constraints, an audit seeks to provide only reasonable assurance that the statements are free from material error. Hence, statistical sampling is often adopted in audits. In the case of financial audits, a set of financial statements are said to be true and fair when they are free of material misstatements – a concept influenced by both quantitative (numerical) and qualitative factors. But recently, the argument that auditing should go beyond just true and fair is gaining momentum. ...
Cost accounting is a process for verifying the cost of manufacturing or producing of any article, on the basis of accounts measuring the use of material, labor or other items of cost. In simple words, the term, cost audit means a systematic and accurate verification of the cost accounts and records, and checking for adherence to the cost accounting objectives. ...
An audit must adhere to generally accepted standards established by governing bodies. These standards assure third parties or external users that they can rely upon the auditor's opinion on the fairness of financial statements, or other subjects on which the auditor expresses an opinion." [Audit. Wikipedia]
The Audit flowchart template for the ConceptDraw PRO diagramming and vector drawing software is included in the Audit Flowcharts solution from the Finance and Accounting area of ConceptDraw Solution Park.
Audit flowchart template
Accounting Data Flow from the Accounting Flowcharts Solution

Accounting Flowcharts Solution contains also a wide variety of templates and samples that you can use as the base for your own Accounting Flowcharts of any complexity.
- Process Flowchart | Basic Flowchart Symbols and Meaning | Flow ...
- Example Of Flowchart In Patient Record
- How to Create Flowcharts for an Accounting Information System ...
- Steps in the Accounting Process | Steps of Accounting Cycle | How ...
- Invoice payment process - Flowchart | Accounting Flowchart ...
- Accounting Flowchart : Purchasing, Receiving, Payable and ...
- Product Record System Flowchart
- Audit Flowcharts | Basic Audit Flowchart . Flowchart Examples | Audit ...
- Process Flowchart | Flowchart Definition | Types of Flowchart ...
- Financial Audit Process Flowchart
- Basic Flowchart Symbols and Meaning | How to create an IDEF3 ...
- Project management life cycle - Flowchart | Basic Diagramming ...
- Flowchart Symbols Accounting. Activity-based costing (ABC ...
- Audit Flowcharts | Audit Flowchart Symbols | Audit Process ...
- Accounting Flowcharts | Accounting Flowchart Purchasing ...
- Accounting Information Systems Flowchart Example
- Basic Flowchart Symbols and Meaning | Cross-Functional Flowchart ...
- Workflow to Make a Purchase. Accounting Flowchart Example
- Block Diagram Of A Record Management System
- Audit Steps | Entity-Relationship Diagram (ERD) | Basic Flowchart ...
- ERD | Entity Relationship Diagrams, ERD Software for Mac and Win
- Flowchart | Basic Flowchart Symbols and Meaning
- Flowchart | Flowchart Design - Symbols, Shapes, Stencils and Icons
- Flowchart | Flow Chart Symbols
- Electrical | Electrical Drawing - Wiring and Circuits Schematics
- Flowchart | Common Flowchart Symbols
- Flowchart | Common Flowchart Symbols