HelpDesk
How to Create a Meter Dashboard

Business Graphics Software
 Status Dashboard
Status dashboard solution extends ConceptDraw DIAGRAM software with templates, samples and vector stencils libraries with graphic indicators for drawing the visual dashboards showing status data.
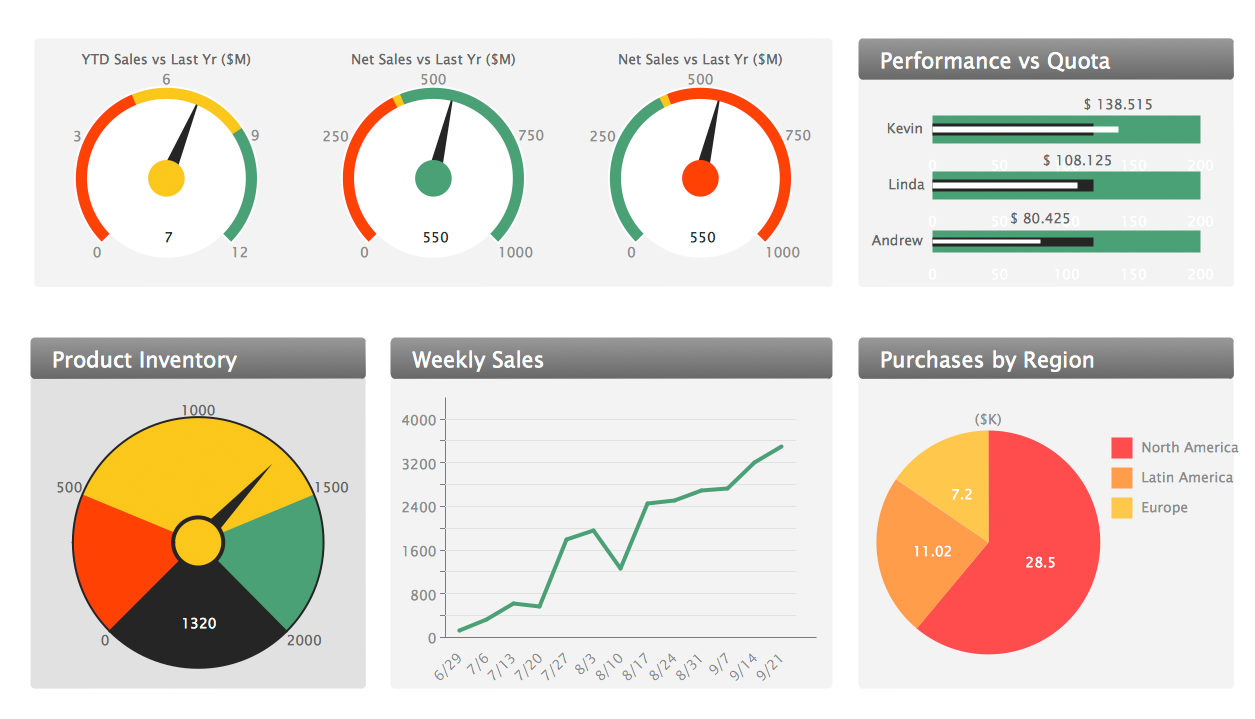
 Meter Dashboard
Meter dashboard solution extends ConceptDraw DIAGRAM software with templates, samples and vector stencils library with meter indicators for drawing visual dashboards showing quantitative data.
 Logistic Dashboard
The powerful tools of Logistic Dashboard solution and specially developed live graphic objects of logistic icons, logistic navigation elements, logistic indicators, logistic charts and logistic maps effectively assist in designing Logistic dashboards, Logistic maps, Logistic charts, diagrams and infographics. The included set of prebuilt samples and quick-start templates, demonstrates the power of ConceptDraw DIAGRAM software in logistics management, its assisting abilities in development, realization and analyzing the logistic processes, as well as in perfection the methods of logistics management.
Sales Dashboard
ConceptDraw DIAGRAM software extended with Sales Dashboard solution from the Marketing area of ConceptDraw Solution Park is effective for visualizing sales data, all set of KPIs on the Sales Dashboard with purpose to see how your business develops and to make conclusions for improvement the sales.
The Facts and KPIs

 HR Dashboard
The HR Dashboard solution extends ConceptDraw DIAGRAM functionality with powerful drawing tools and great collection of comprehensive vector design elements, icons, pictograms and objects, navigation elements, live objects of HR charts, HR indicators, and thematic maps. The range of HR Dashboards applications is extensive, among them the human resource management, recruitment, hiring process, human resource development. ConceptDraw DIAGRAM software is perfect for creation HR Dashboard with any goal you need. It gives you all opportunities for designing not only informative, but also professional looking and attractive HR Dashboards of any style and degree of detalization, that are perfect for using in presentations, reports and other thematic documents.
KPI Dashboard

HelpDesk
How to Create a Time Series Dashboard

- Business Graphics Software | KPI Dashboard | Business Intelligence ...
- Dashboard Vector Graphics
- Project tasks dashboard | Sales Activity Graphic Report
- Design elements - Meter indicators | Meter Dashboard | Meter ...
- Design elements - Status indicators | Status Dashboard | iPhone OS ...
- Dashboard Graphics
- KPI Dashboard | Enterprise dashboard | Business Graphics ...
- Status Dashboard | Design elements - Status indicators | Status ...
- Status Dashboard | Projects HR dashboard | A KPI Dashboard ...
- Progress Dashboard Examples
- ERD | Entity Relationship Diagrams, ERD Software for Mac and Win
- Flowchart | Basic Flowchart Symbols and Meaning
- Flowchart | Flowchart Design - Symbols, Shapes, Stencils and Icons
- Flowchart | Flow Chart Symbols
- Electrical | Electrical Drawing - Wiring and Circuits Schematics
- Flowchart | Common Flowchart Symbols
- Flowchart | Common Flowchart Symbols