IDEF0 Diagram
The vector stencils library IDEF0 Diagram from the solution IDEF0 Diagrams contains specific IDEF0 diagram symbols such as arrow symbols and entity symbols for ConceptDraw PRO diagramming and vector drawing software. The IDEF0 Diagram solution is contained in the Software Development area of ConceptDraw Solution Park.Structured Systems Analysis and Design Method (SSADM) with ConceptDraw PRO
Structured Systems Analysis and Design Method SSADM is the method which is used at projecting and analysis of information systems. SSADM is based on the data flow diagrams. At the description of data flows out of the system and into the system DFD, which denote boundaries of the system, are used.Data Flow Diagram Examples
You need to draw the Data Flow Diagram? Use ConceptDraw PRO diagramming and vector drawing software extended with Data Flow Diagrams solution from the Software Development area of ConceptDraw Solution Park.The Data Flow Diagrams solution provides a numerous collection of Data Flow Diagram examples created according to Gane and Sarson, and Yourdon and Coad notations using the ConceptDraw PRO software.Data structure diagram with ConceptDraw PRO
Data structure diagram (DSD) is intended for description of conceptual models of data (concepts and connections between them) in the graphic format for more obviousness. Data structure diagram includes entities description, connections between them and obligatory conditions and requirements which connect them. Create Data structure diagram with ConceptDraw PRO.Types of Flowcharts
A Flowchart is a graphically representation of the process, algorithm or the step-by-step solution of the problem. There are ten types of Flowcharts. Using the Flowcharts solution from the Diagrams area of ConceptDraw Solution Park you can easy and quickly design the Flowchart of any of these types.
Design Data Flow. DFD Library
Three DFD libraries, 49 vector shapes. Use these DFD symbol libraries to design the process-oriented models, data-oriented models, data flowcharts, data process diagrams, structured analysis diagrams, and information flow diagrams.DFD Flowchart Symbols
A Data Flow Diagram (DFD) is a graphical technique which allows effectively model and analyze the information processes and systems. The ability to fast and easy create the DFDs is made possible with Data Flow Diagrams solution from the Software Development area of ConceptDraw Solution Park. For designing the Data Flow Diagrams are used simple DFD flowchart symbols which are connected each other by arrows depicting the data flow from one step to another.JSD - Jackson system development
Jackson System Development (JSD) is a linear method of system development created by Michael A. Jackson and John Cameron in the 1980s. It comprises the whole software life cycle directly or providing a framework for more specialized techniques.When implementing the Jackson System Development method and designing JSD diagrams, you can succesfully use the powerful and helpful tools of ConceptDraw PRO software extended with Entity-Relationship Diagram (ERD) solution from the Software Development area of ConceptDraw Solution Park.
Jacobson Use Cases Diagram
The vector stencils library UML Use Case contains specific symbols of the UML notation such as actors, actions, associations and relationships for the ConceptDraw PRO diagramming and vector drawing software. This library is contained in the Rapid UML solution from Software Development area of ConceptDraw Solution Park.ConceptDraw Arrows10 Technology
When using a shapes′ center connection the connection becomes dynamic, the connector will trace the contour of the object, when moving the object inside your diagram.Using any other connection point provides a static connection, when you move connected objects the connector stays attached to the same point.
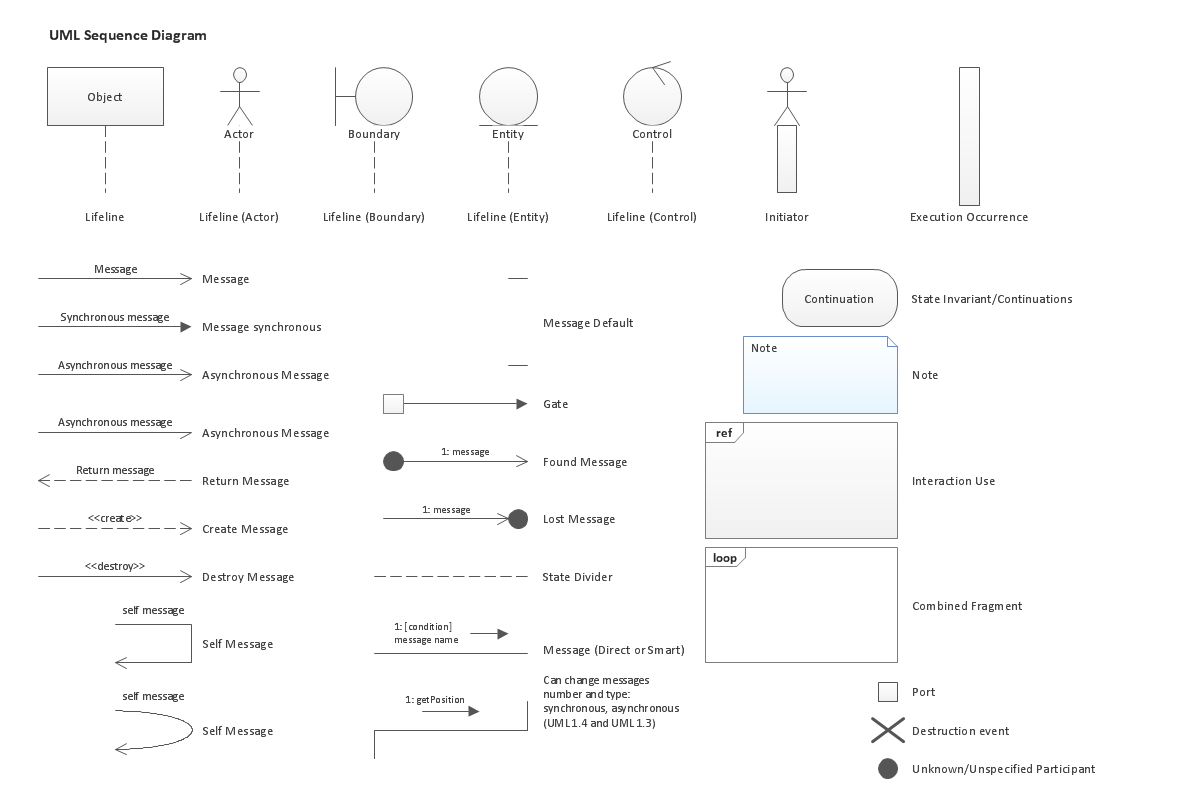
UML Sequence Diagram. Design Elements
UML Sequence Diagram shows object interactions arranged in time sequence, how processes operate with one another and in what order and illustrate the sequence of messages exchanged between the objects and classes involved in the scenario.
Data Flow Diagram (DFD)
This example is created using ConceptDraw PRO enhanced with solution Data Flow Diagrams. This diagram shows one of the business processes to simplify and accelerate understanding, analysis, and representation.Software Diagram Examples and Templates
ConceptDraw Pro is a powerful tool for business and technical diagramming.Software Development area of ConceptDraw Solution Park provides 5 solutions:
Data Flow Diagrams, Entity-Relationship Diagram (ERD), Graphic User Interface, IDEFO Diagrams, Rapid UML.
Gane Sarson Diagram
The vector stencils library Gane-Sarson Notation from the solution Data Flow Diagrams contains specific symbols of the Gane-Sarson notation such as process symbol, connector symbol, jump symbol for ConceptDraw PRO diagramming and vector drawing software. The Data Flow Diagrams solution is contained in the Software Development area of ConceptDraw Solution Park.UML Flowchart Symbols
The UML diagram is a powerful tool which lets visually represent all system's components, the interactions between them and relationships with external user interface.The Rapid UML solution for ConceptDraw PRO software offers diversity of UML flowchart symbols for drawing all types of UML diagrams.
- Difference Between Yourdon And Ssadm
- Illustrate The Difference Between Gane Sarson And Yourdon
- Difference Between Ssadm And Yourdon
- Differences Between Yourdon And Ssadam Techniques
- Differences Between Yourdon And Ssadam System Design
- Difference Between Context Diagram And Data Flow Diagram
- Differences Between Gane And Sarson And Yourdon Symbols
- DFD, Yourdon and Coad notation - Template | Yourdon and Coad ...
- Yourdon and Coad Diagram | DFD, Yourdon and Coad notation ...
- Yourdon and Coad Diagram | Design Data Flow. DFD Library | DFD ...
- Difference Between Gane Ad Sarson And Youron Symbols
- Difference Between Data Flow Diagram And Architecture Diagram
- What Is The Difference Between An External Entity And A Process In
- Difference Between Context Diagram And Dfd
- The Difference Between Dfd Levels
- Difference Btwn Data Flow Diagrams And A Rich Picture
- Difference Between Context Diagram And Dataflow Diagram Sample
- Difference Between Ooad And Ssadm
- Yourdon Vs Gane And Sarson
- Difference Between 0 Level Dfd And 1 Level Dfd
- ERD | Entity Relationship Diagrams, ERD Software for Mac and Win
- Flowchart | Basic Flowchart Symbols and Meaning
- Flowchart | Flowchart Design - Symbols, Shapes, Stencils and Icons
- Flowchart | Flow Chart Symbols
- Electrical | Electrical Drawing - Wiring and Circuits Schematics
- Flowchart | Common Flowchart Symbols
- Flowchart | Common Flowchart Symbols


