ConceptDraw DIAGRAM ER Diagram Tool

ConceptDraw ER Diagram Tool works across any platform, meaning you never have to worry about compatibility again. ConceptDraw DIAGRAM allows you to make Entity-Relationship Diagram (ERD) on PC or macOS operating systems.
Entity Relationship Diagram - ERD - Software for Design Crows Foot ER Diagrams
_Win_Mac.png)

Entity Relationship Diagram Symbols

ERD symbols used for professional ERD drawing are collected in libraries from the Entity-Relationship Diagram (ERD) solution for ConceptDraw DIAGRAM.
ConceptDraw DIAGRAM Database Modeling Software

UML Class Diagram Generalization Example UML Diagrams

This sample describes the use of the classes, the generalization associations between them, the multiplicity of associations and constraints. Provided UML diagram is one of the examples set that are part of Rapid UML solution.
Data Modeling with Entity Relationship Diagram

The best ERD tool for the Mac and Windows is ConceptDraw DIAGRAM software extended with the Entity-Relationship Diagram (ERD) solution from the Software Development Area for ConceptDraw Solution Park, which is sharpened for professional ERD drawing and data modeling with Entity Relationship Diagram.
UML Class Diagram Notation

The Best Mac Software for Diagramming or Drawing


UML Class Diagrams. Diagramming Software for Design UML Diagrams
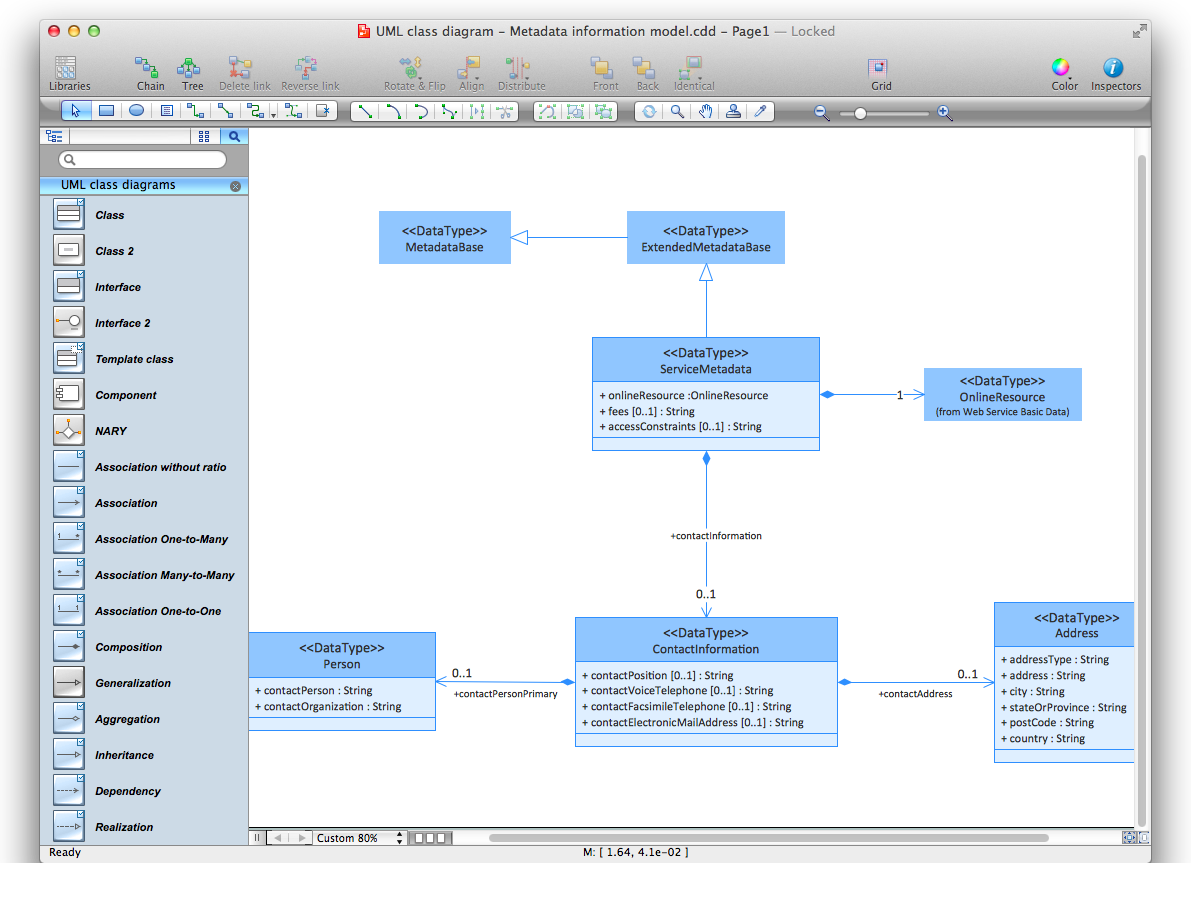
Use ConceptDraw DIAGRAM with UML class diagram templates, samples and stencil library from Rapid UML solution to show the classes of system, their attributes, operations or methods, and the relationships among the classes.

- Tool To Draw Conceptual Model
- Conceptdraw.com: Mind Map Software, Drawing Tools | Project ...
- Programs To Draw Conceptual Models
- Conceptual Draw Data Flow Diagram Software Download
- Entity Relationship Diagram Symbols | ConceptDraw PRO ER ...
- ER Diagram Tools For Mac Logical Model
- ConceptDraw PRO ER Diagram Tool | Entity Relationship Diagram ...
- Er Diagram Drawing Tool Free Download
- Process Flowchart | ConceptDraw PRO ER Diagram Tool | Amazon ...
- Mac Class Diagram Tool
- ERD | Entity Relationship Diagrams, ERD Software for Mac and Win
- Flowchart | Basic Flowchart Symbols and Meaning
- Flowchart | Flowchart Design - Symbols, Shapes, Stencils and Icons
- Flowchart | Flow Chart Symbols
- Electrical | Electrical Drawing - Wiring and Circuits Schematics
- Flowchart | Common Flowchart Symbols
- Flowchart | Common Flowchart Symbols