Samples / Graphs and Charts / Sample Business Diagrams
Sample Business Diagrams
Samples of Business Diagrams (Area Charts, Line Graphs, Scatter Plots) are created using the ConceptDraw DIAGRAM diagramming and vector drawing software enhanced with business diagramming solutions from ConceptDraw Solution Park. The ConceptDraw DIAGRAM offers you a variety of diagramming tools, and solutions from the Solution Park provide diagram templates and libraries of ready-made charts and shapes for quick and simple drawing professional-quality business diagrams. ConceptDraw DIAGRAM provides export of vector graphic multipage documents into multiple file formats: vector graphics (SVG, EMF, EPS), bitmap graphics (PNG, JPEG, GIF, BMP, TIFF), web documents (HTML, PDF), PowerPoint presentations (PPT), Adobe Flash (SWF).
Tutorials and Solutions:
Video Tutorials: ConceptDraw Solution Park
Solutions: Basic Diagramming for ConceptDraw DIAGRAM
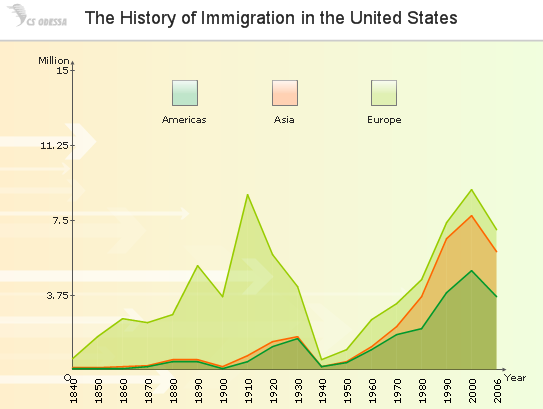
Sample 1: Area Chart — The History of Immigration in the United States
Area Chart sample: The history of immigration in the United States.
This example is created using ConceptDraw DIAGRAM diagramming software enhanced with
solution Basic Diagramming from ConceptDraw Solution Park.
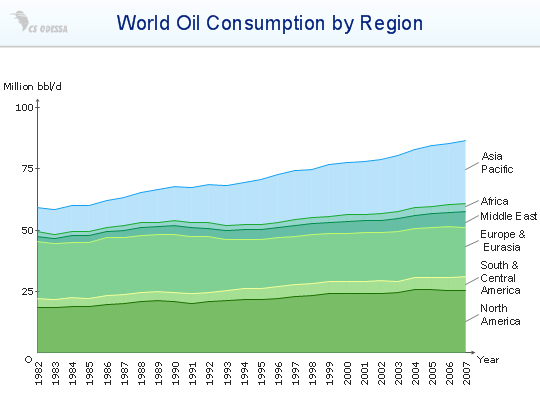
Sample 2: Area Chart — World Oil Consumption by Region
Area Chart sample: World oil consumption by region.
This example is created using ConceptDraw DIAGRAM diagramming software enhanced with
solution Basic Diagramming from ConceptDraw Solution Park.
Sample 3: Line Graph — United States Population Growth
Line Graph sample: United States population growth.
This example is created using ConceptDraw DIAGRAM diagramming software enhanced with
solution Basic Diagramming from ConceptDraw Solution Park.

Sample 4: Line Graph — Licensed Drivers, Vehicle Registrations and Resident Population
Line Graph with 3 series sample: Licensed drivers, vehicle registrations and resident population.
This example is created using ConceptDraw DIAGRAM diagramming software enhanced with
solution Basic Diagramming from ConceptDraw Solution Park.

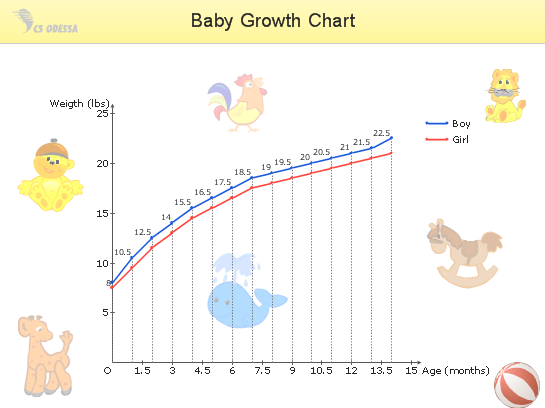
Sample 5: Line Chart — Baby Growth
Line Graph sample: Baby growth chart.
This example is created using ConceptDraw DIAGRAM diagramming software enhanced with
solution Basic Diagramming from ConceptDraw Solution Park.
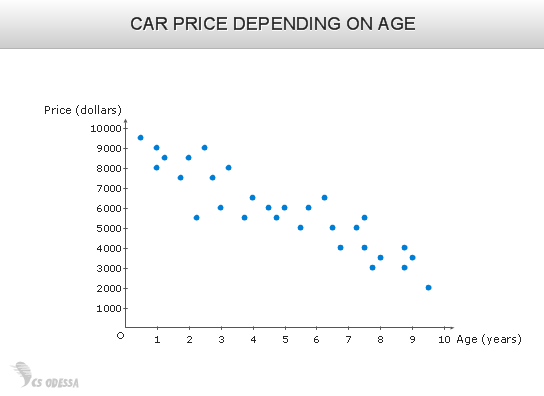
Sample 6: Scatter Diagram — Car Price Depending on Age
Scatter Plot sample: Car price depending on age.
This example is created using ConceptDraw DIAGRAM diagramming software enhanced with
solution Basic Diagramming from ConceptDraw Solution Park.
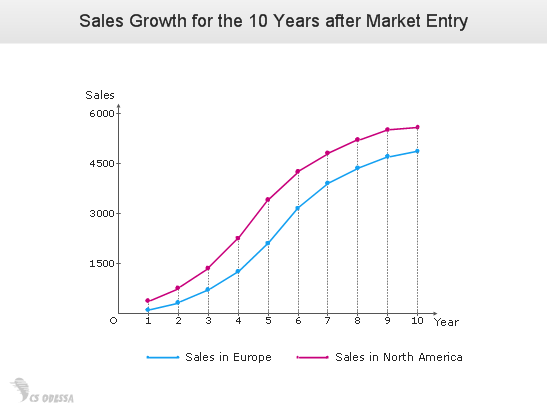
Sample 7: XY Scatter Chart — Annual Sales Growth after Market Entry
Scatter Plot sample: Annual sales growth after market entry.
This example is created using ConceptDraw DIAGRAM diagramming software enhanced with
solution Basic Diagramming from ConceptDraw Solution Park.
All samples are copyrighted CS Odessa's.
Usage of them is covered by Creative Commons “Attribution Non-Commercial No Derivatives” License.
The text you can find at: https://creativecommons.org/licenses/by-nc-nd/3.0