Milestone Chart
Milestones are a useful and high-effective tool in project management, they help mark the control points or important key moments in the course of project execution, and accordingly, they contribute to the effective development of the project productivity and monitoring any project‘s progress. The milestones are the perfect way to accurately determine whether the project runs exactly on schedule or not, is ahead of a plan or behind it. They are also perfect for representing the tasks or even the whole phases of the project that are implemented by some external companies.
The ConceptDraw PROJECT application is a powerful engine for detailed planning of the projects and for managing them effectively, which also gives the ability to set milestones in project documents created with its help. A milestone is represented as a diamond-shaped marker with the date near it on a Gantt Chart in ConceptDraw PROJECT The milestone marks the completion of some key stage in a given project, it does not have any duration and can take one of two complete statuses – complete 100% or not complete 0%.
Pic 1. ConceptDraw PROJECT — Milestone Chart
One of the ways to track the project milestones is to use the special types of reports. ConceptDraw PROJECT software perfectly suits not only for planning and implementing the projects but for obligatory reporting results on each stage of project execution. There are many ways of reporting in ConceptDraw PROJECT, one of the most vivid and useful ones is the visualization of a project with the help of Visual Project Diagrams.
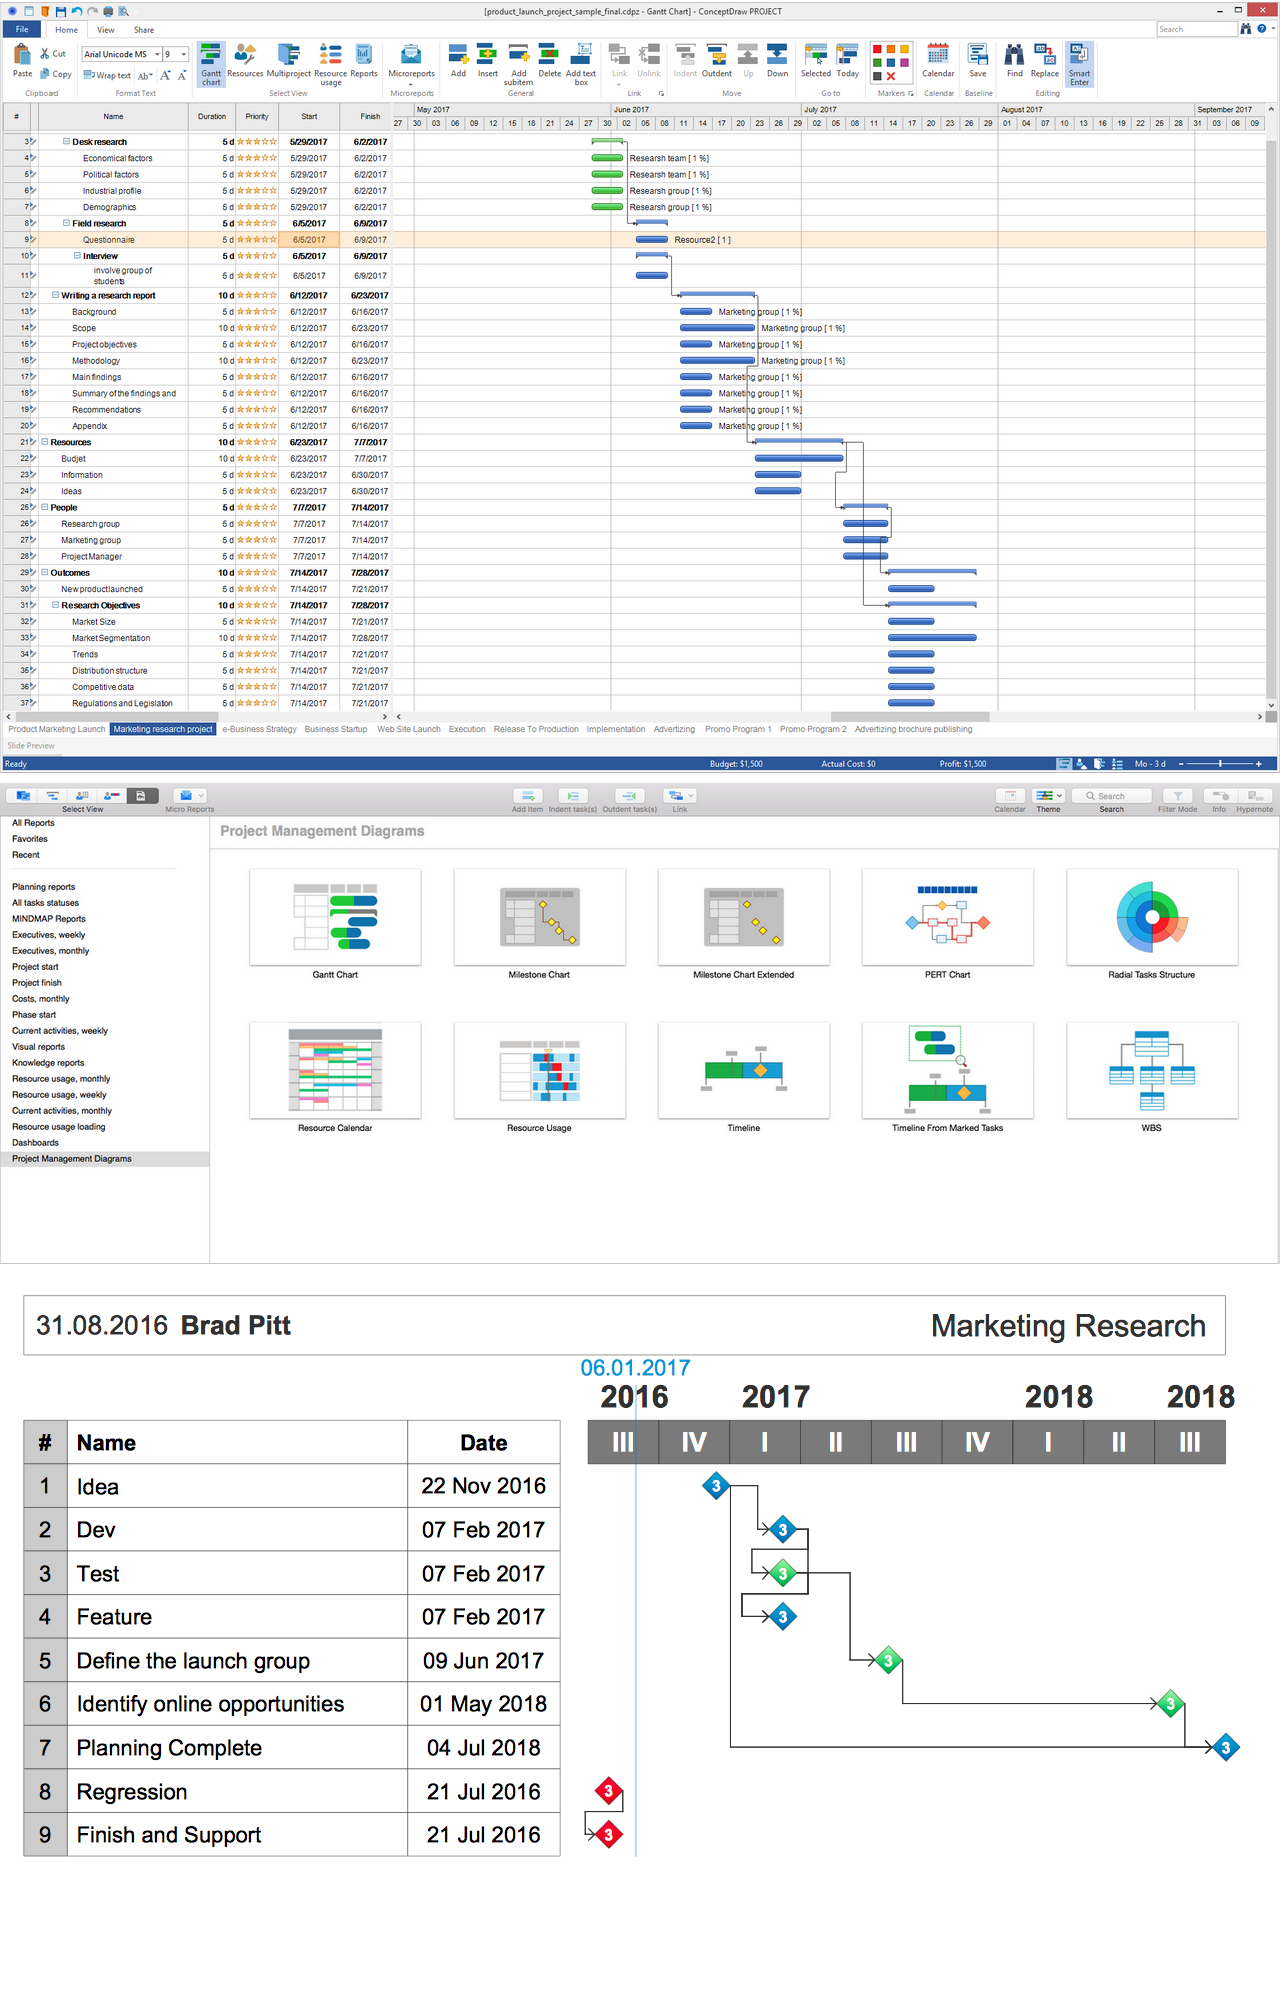
The Milestone Chart is one of report visual diagrams available for generating by clicking the corresponding button on the Reports toolbar in ConceptDraw PROJECT This type of visual report is the best way to visually show the project milestones as diamonds with numbers corresponding to their priorities, the scheme of links between them on a timeline, and also their names and dates in the table. It is an informative chart, which is based on the project’s data and lets assemble all key points of project execution together.
When creating a Milestone Chart for a multi-project, you will receive a set of Milestone Charts for all projects of this multi-project. The Milestone Chart for each project displays the project name and the name of a responsible project manager, the list of linked project milestones with dates, the project timeline with a scheme of relations the milestones of a given project. Each milestone is represented as a diamond with a number displaying its priority.