What is a Dashboard, and Why Should Your Business Use One?
Picture yourself behind the wheel of your car. On the dashboard in front of you are gauges that tell you how fast you’re going, how much fuel you have, and other information that you need to make sure you arrive safely and on time to your destination. With a glance you can tell if you need to speed up or slow down, if you need gas or fluids. Now, it’s possible you could drive around without looking at those gauges, matching your speed to the vehicles around you, guessing that you need to fill up every few days — but would that be the best way? Aren’t you better off relying on the gauges to tell you exactly how you’re doing at any given moment?Dashboards for business are the same basic concept: they display your status at any given moment. Except instead of the vehicle manufacturer choosing to measurespeed, fuel, and engine RPM, you the business owner decide what will be the Key Performance Indicatorsof your success. Then you track those KPI in one or more graphs that update dynamically. The graphs form your dashboard, showing you at glance the rate you’re progressing. The result is you stop wasting time guessing and instead start strategizing effectively for the future.
KPI dashboarding is such a practical necessity for business today that a variety of software toolshave sprung up to provide it. But for ease of configuration and design, as well as flexibility, simplicity, and economy, your first choice should be ConceptDraw PRO 9 and the “What is a Dashboard” Area, available now in ConceptDraw Solution Park. This downloadable plugin solutions show you how to associate ConceptDraw PRO’s numerous new dashboard objects with data files of your KPI to create dynamic visualizations that update in real time. New types of dashboard objects in this area include Comparison Dashboard, Composition Dashboard, Correlation Dashboard, Frequency Distribution Dashboard, Meter Dashboard, Spatial Dashboard, Status Dashboard, and Time Series Dashboard. Each of these categories contains multiple new objects and templates that make the power and insight of dashboarding for business more affordable than ever before.

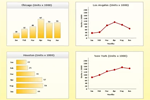

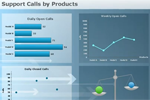
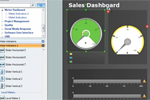
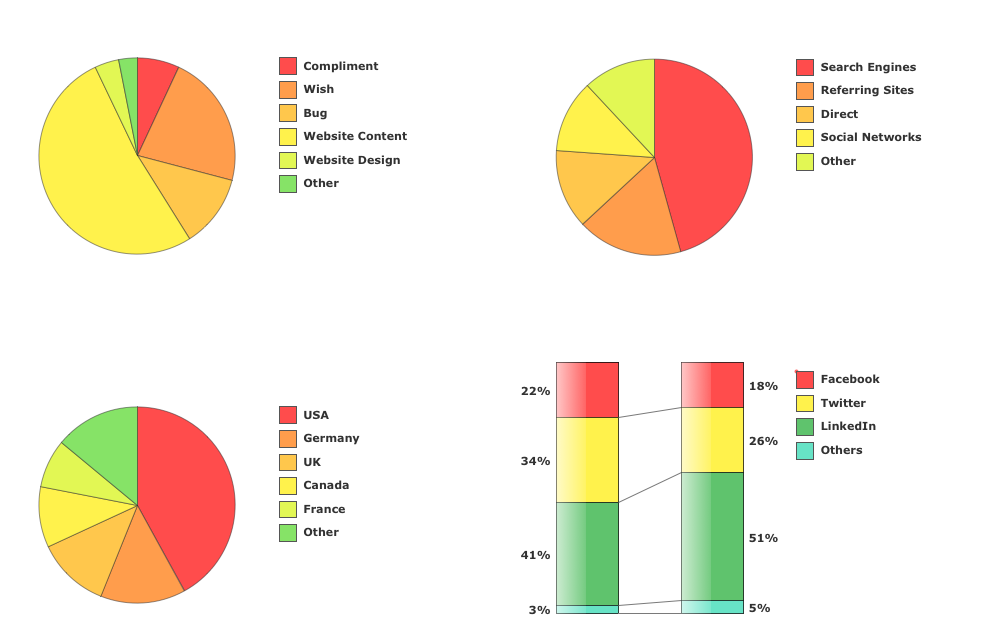
Samples Gallery