 Time Series Dashboard Solution. ConceptDraw.com
Time series dashboard solution extends ConceptDraw PRO software with
templates, samples and vector stencils libraries with charts, graphs and plots for

Wikipedia] The vector stencils library " Time series charts" contains 10 templates:
3 The example "Design elements - Time series charts" is included in the Time
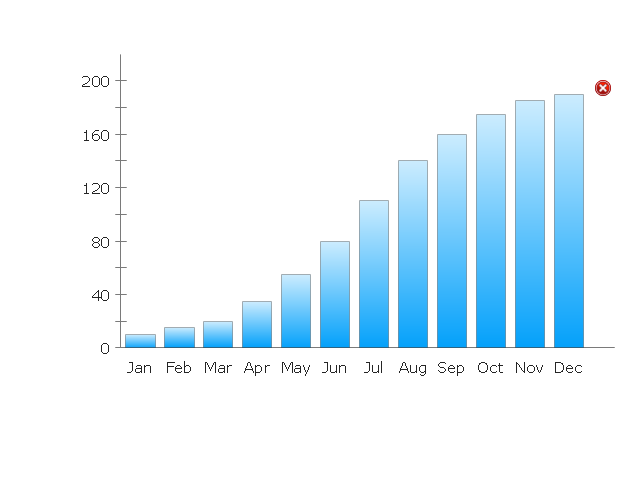
The vector stencils library " Time series charts" contains 10 templates of time
series charts: 3 column charts, 3 bar charts, 2 line graphs and 2 dot plots. All
these
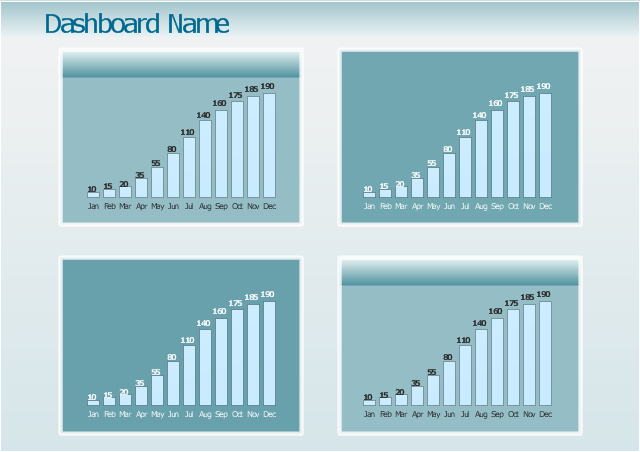
The business performance dashboard template " Time series digital vector
drawing software is included in the Time Series Dashboard solution from the
area
"A time series is a sequence of data points, measured typically at successive
points in time spaced at uniform time intervals. Time series are very frequently
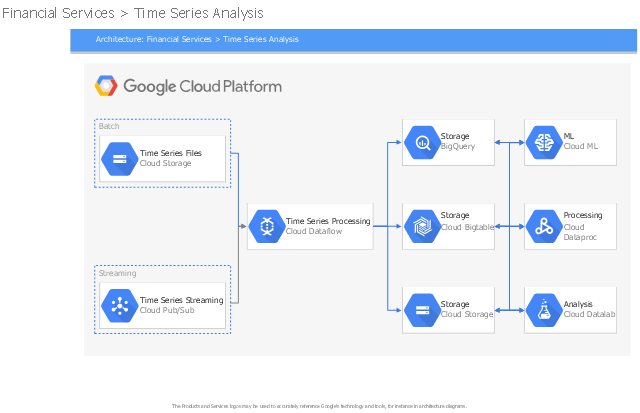
This Google Cloud Platform (GCP) architectural diagram example illustrates
financial services and time series analysis. It was drawn on the base of slide 59
from

HelpDesk
How to Connect Text Data to a Time Series Chart on Your Live
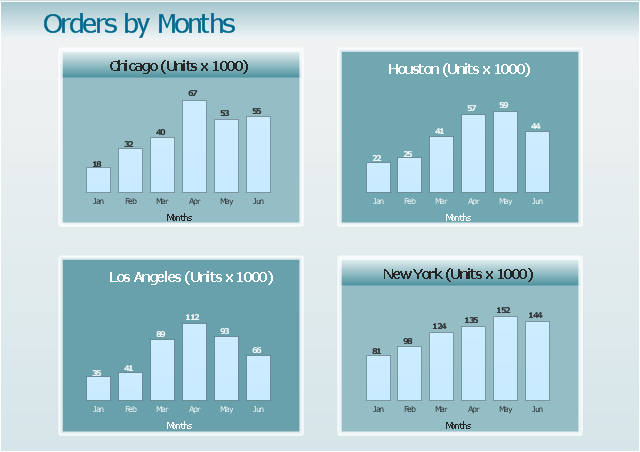
Time Series Dashboard means an integration of some type of diagrams: Line Charts, Bar Charts, Column Charts, and Dot Plots on a single space.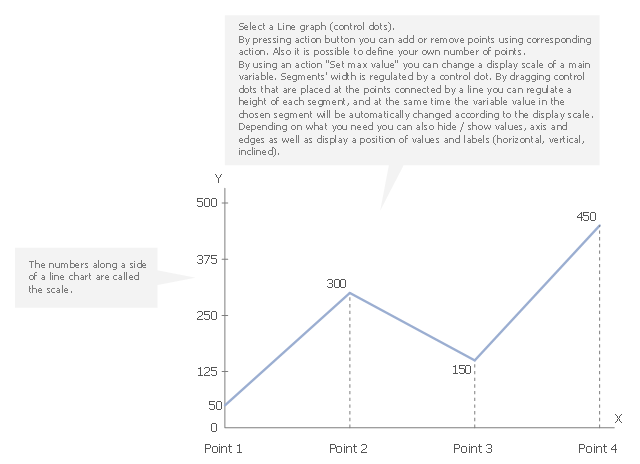
This line graph templates shows the number of tourists visiting the resort town for
six months. Use it to design your time series line charts in ConceptDraw PRO
- Time Series Dashboard | Time series charts - Vector stencils library ...
- Line Chart Templates | Design elements - Time series charts | Line ...
- Time Series Dashboard Solution
- Time Series Dashboard | Design elements - Time series charts ...
- Note Exchange | Time Series Dashboard | Spatial Infographics ...
- How to Connect Text Data to a Time Series Chart on Your Live ...
- Time series charts - Vector stencils library
- Analytical Time Series Graph
- Line Graph Templates
- Design elements - Time series charts | How to Create a Line Chart ...
- ERD | Entity Relationship Diagrams, ERD Software for Mac and Win
- Flowchart | Basic Flowchart Symbols and Meaning
- Flowchart | Flowchart Design - Symbols, Shapes, Stencils and Icons
- Flowchart | Flow Chart Symbols
- Electrical | Electrical Drawing - Wiring and Circuits Schematics
- Flowchart | Common Flowchart Symbols
- Flowchart | Common Flowchart Symbols