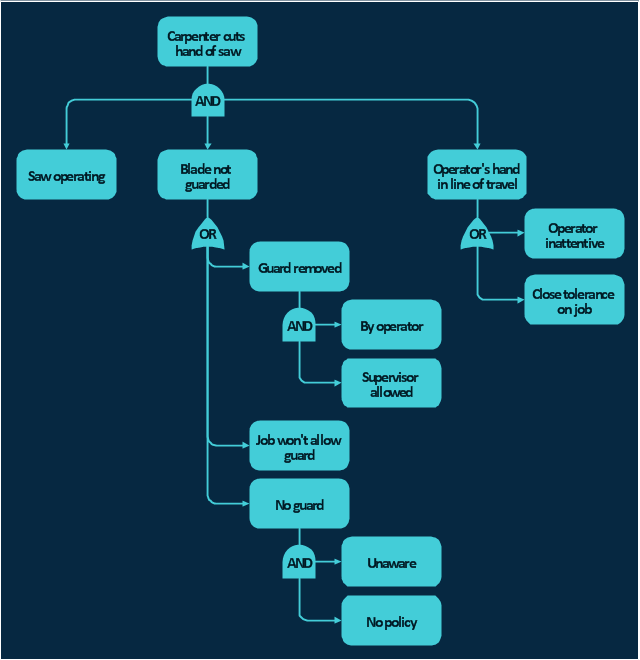
The FTA diagram example " Hazard analysis " was redesigned from the illustration
of the article " Hazard Analysis Methodologies" from the Occupational Safety &
Health Administration (OSHA) website. "A fault tree analysis is a quantitative
assessment of all of the undesirable outcomes, such as a toxic gas release or
 Fault Tree Analysis Diagrams Solution. ConceptDraw.com
This solution extends ConceptDraw PRO v9.5 or later with templates, fault tree
analysis example, samples and a library of vector design elements for drawing
FTA diagrams (or negative analytical trees), cause and effect diagrams and fault
tree diagrams.

The most severe conditions require the most extensive fault tree analysis. These "
system Failure Conditions" and their classification are often previously
determined in the functional Hazard analysis ." [Fault tree analysis. Wikipedia]
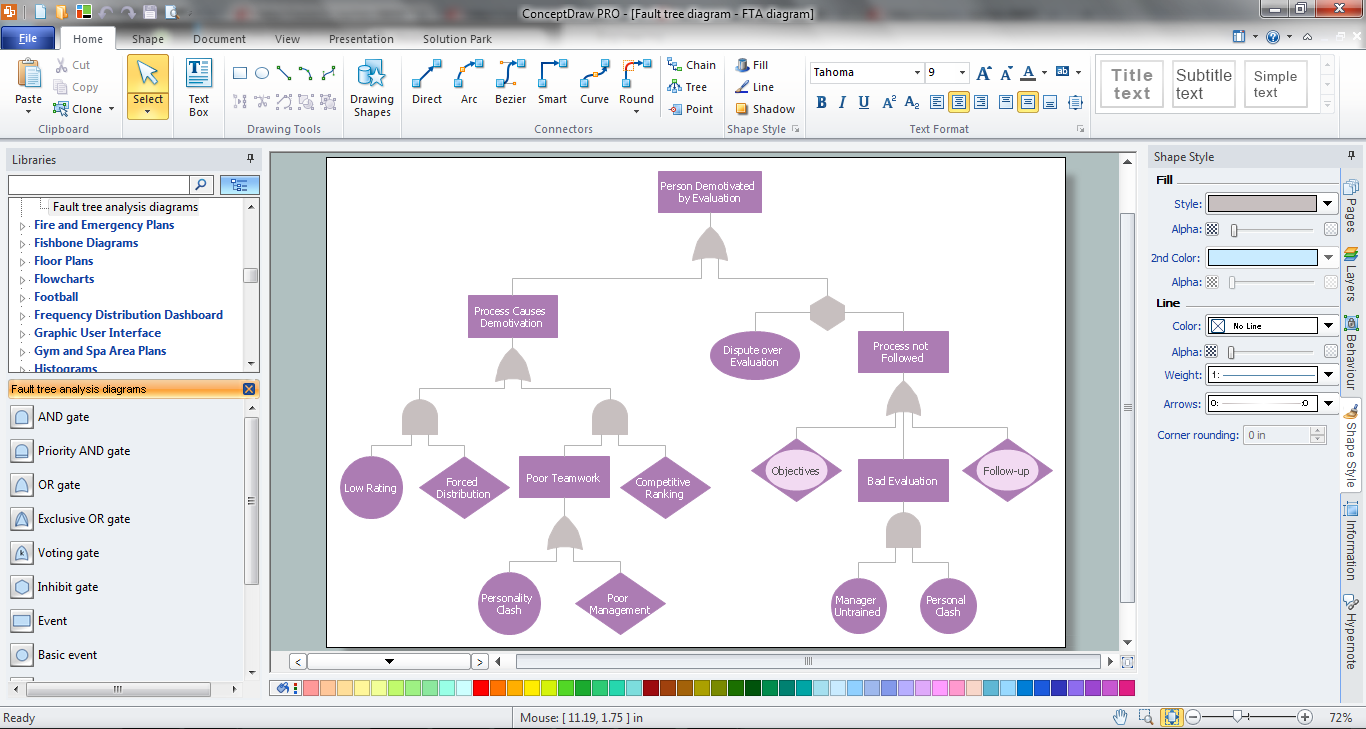
The shapes example "Fault tree analysis diagrams" was created using the
ConceptDraw
 Transport Hazard Pictograms. ConceptDraw.com
Transport Hazard Pictograms solution includes large variety of specially
developed samples with transport hazard symbols and pictograms, and the
whole set of predesigned vector transport GHS pictograms download and used
with ease from the Transport Hazard Pictograms library. Apply them for quick
designing
-piping-and-instrumentation-diagram-template.png--diagram-flowchart-example.png)
During the design stage, the diagram also provides the basis for the development
of system control schemes, allowing for further safety and operational
investigations, such as a Hazard Analysis and Operability Study For processing
facilities, it is a pictorial representation of: Key piping and instrument details,
Control and
 GHS Hazard Pictograms Solution. ConceptDraw.com
GHS Hazard Pictograms solution contains the set of predesigned standard GHS
pictograms, Hazardous symbols, and Hazard communication pictograms,
approved and agreed by UN in Globally Harmonized System of Classification
and Labelling of Chemicals (GHS). They can be used for quick and simple
designing
 SWOT Analysis Solution. ConceptDraw.com
SWOT and TOWS Matrix Diagrams solution extends ConceptDraw PRO and
ConceptDraw MINDMAP software with features, templates, samples and libraries
of vector stencils for drawing SWOT and TOWS analysis matrices and mind maps
.

The FTA diagram sample "Fault tree analysis - Insulin delivery system" was
redesigned from the illustration of "CMSI 641: Introduction to Software
Engineering. Design of Critical Systems. B.J. Johnson. 2005. Loyola Marymount
University". "Another way of assessing hazards is using fault tree analysis . In this
process, each
 Fishbone Diagrams Solution. ConceptDraw.com
The Fishbone Diagrams solution extends ConceptDraw PRO v10 software with
the ability to easily draw the Fishbone Diagrams (Ishikawa Diagrams) to clearly
see the cause and effect analysis and also problem solving. The vector graphic
diagrams produced using this solution can be used in whitepapers, presentations
,
- FTA diagram - Hazard analysis | Design elements - Fault tree ...
- FTA diagram - Hazard analysis | Accident analytic tree - FTA ...
- Code fault tree | Preliminary Hazard Analysis
- FTA diagram - Hazard analysis | Fta Explosion
- FTA diagram - Hazard analysis | High level fault tree | Fault Tree ...
- GHS Hazard Pictograms | Transport Hazard Pictograms | Hazard ...
- FTA diagram - Hazard analysis | Block Diagrams | Seven ...
- Fault Tree Analysis Software | Design elements - Fault tree analysis ...
- Free Fault Tree Analysis Of Hazard Operability
- Fault Tree Analysis Of Failure Transfer Case
- ERD | Entity Relationship Diagrams, ERD Software for Mac and Win
- Flowchart | Basic Flowchart Symbols and Meaning
- Flowchart | Flowchart Design - Symbols, Shapes, Stencils and Icons
- Flowchart | Flow Chart Symbols
- Electrical | Electrical Drawing - Wiring and Circuits Schematics
- Flowchart | Common Flowchart Symbols
- Flowchart | Common Flowchart Symbols