


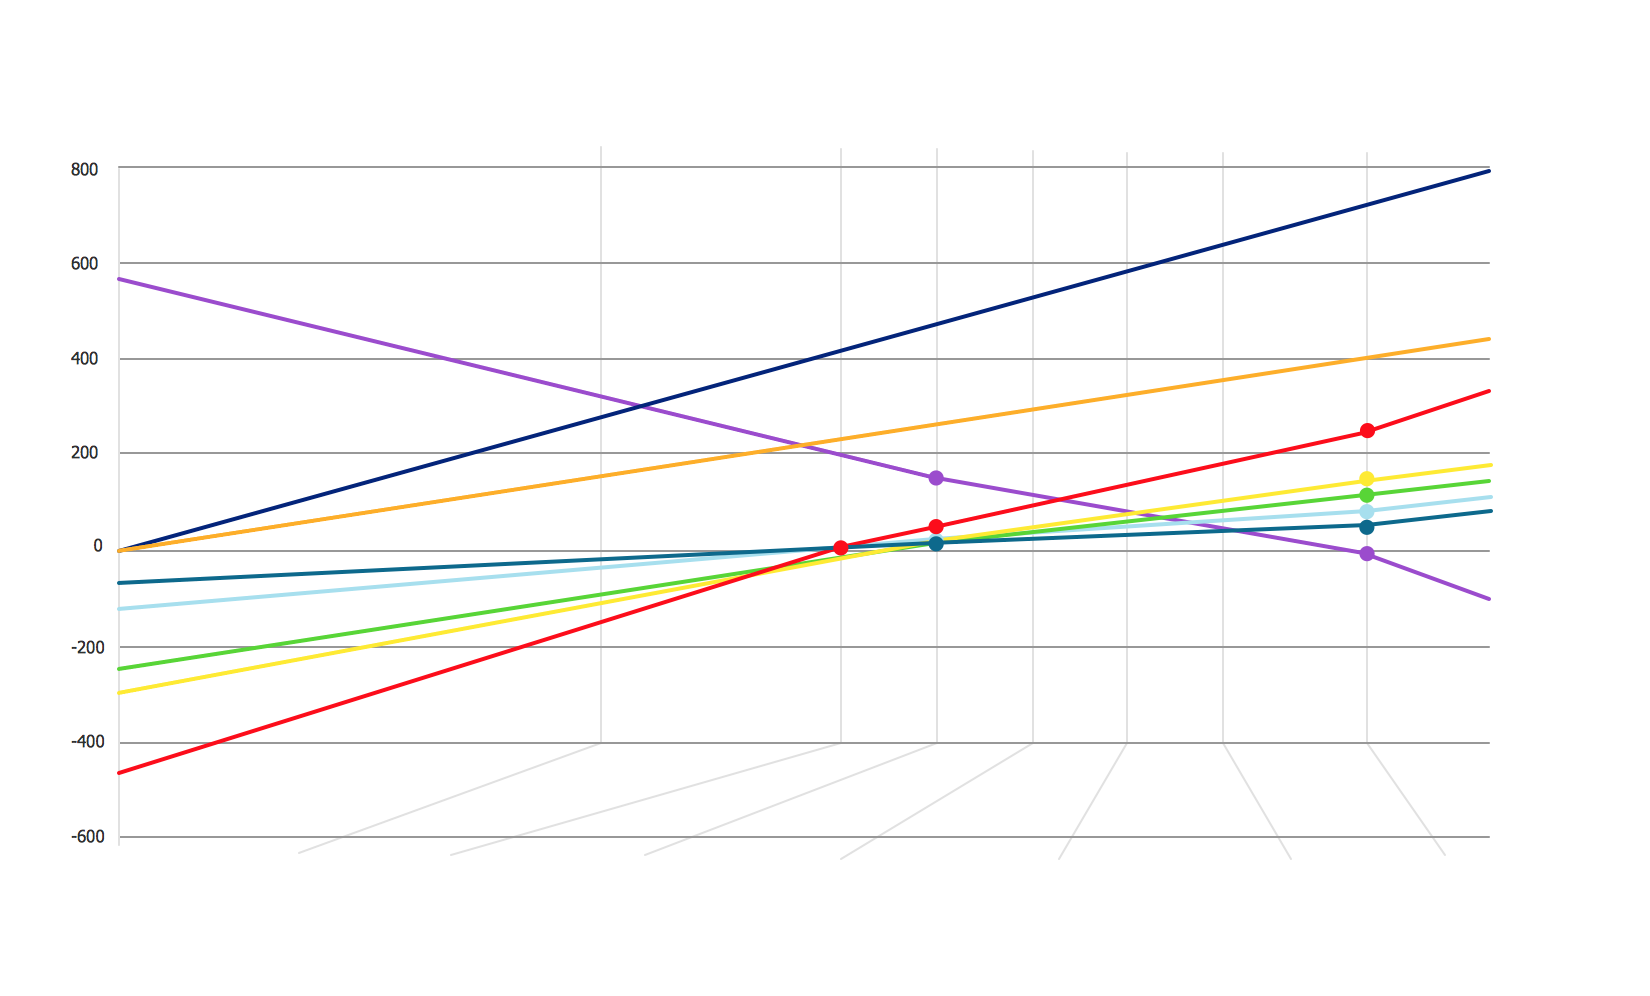
The vector stencils library Comparison charts contains 4 Live Objects: Horizontal
bar chart , Column chart (Vertical bar chart ), Line chart and Dot plot (Scatter
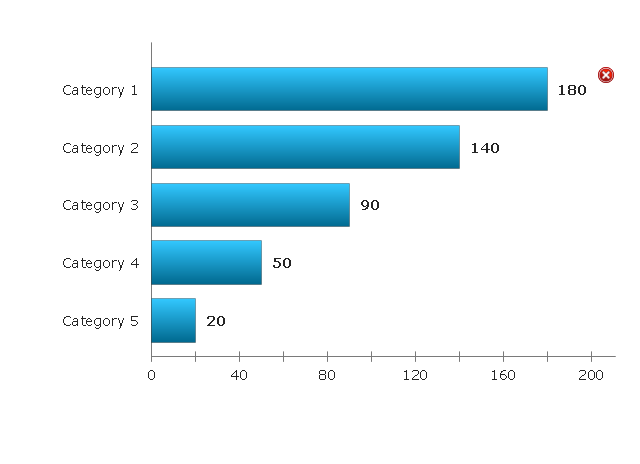
The vector stencils library " Comparison charts " contains 4 Live Objects:
Horizontal bar chart template, Column chart (Vertical bar chart ) template, Line
chart
 Comparison Dashboard Solution. ConceptDraw.com
Comparison dashboard solution extends ConceptDraw PRO software with
samples, templates and vector stencils library with charts and indicators for
drawing
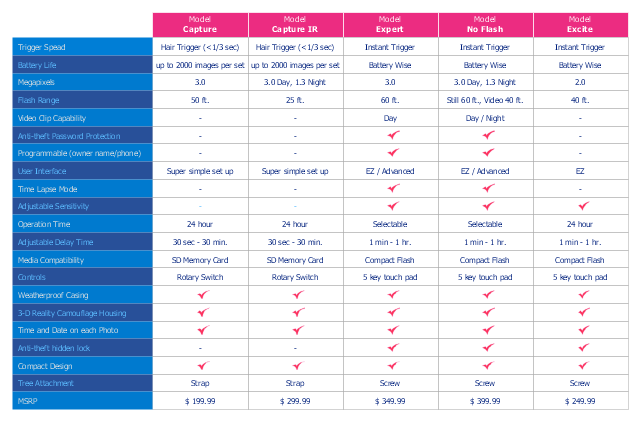
Competitive Feature Comparison Matrix is a tool to compare the features and
functionality of competitive products or services in side-by-side table. The feature

ConceptDraw - business flowchart tool, diagram drawing
Having your own businesses or working in somebody’s ones you face the problems with needs of making flowcharts time to time in order to structure your work and visualize information. And when you are about to make any kind of diagrams you need proper graphic application to be helpful in your business. Using ConceptDraw DIAGRAM software is always the right solution as there’s an option of choosing the existing examples of various kinds of flowcharts, organizational charts, diagrams. Hundreds of design elements are available for you and you can always use it from Solutions on our site. Check it out and make your own basic, audit flowcharts, cause-effect diagrams, cross-functional, vertical, horizontal ones as well as data flow diagrams and so many more other plans. Once you start you realize how simple it is to use this tool in terms of making your own professional looking charts.
Use these design elements to visualize composition comparison of your data in
Pie charts also take up a larger amount of space on the page compared to the


HelpDesk
Drawing a Pictorial Charts. ConceptDraw HelpDesk
A Pictorial chart is a type of Pictorial Infographics. It is used to visually present data comparison . Pictorial charts use relative sizes or repetitions of the same icon ,
How to Create Presentation of Your Project Gantt Chart
PowerPoint presentation of a project

Sales Growth. Bar Graphs Example, Column Chart Example
Sales Growth. Bar Graphs Example
Bar Diagrams for Problem Solving - business management bar charts
Bar Diagrams for Problem Solving - business management bar charts- Feature Comparison Chart Software | Financial Comparison Chart ...
- Performance Indicators | Design elements - Composition charts and ...
- Financial Comparison Chart | Feature Comparison Chart Software ...
- Feature Comparison Chart Software | Marketing | Bar Chart ...
- Design elements - Comparison charts and indicators
- Design elements - Comparison charts and indicators | Comparison ...
- Feature Comparison Chart Software | Competitive feature ...
- Comparison Dashboard | Design elements - Comparison charts and ...
- Design elements - Comparison charts and indicators | Composition ...
- Design elements - Comparison charts and indicators | Design ...
- Financial Comparison Chart | Bar Diagrams for Problem Solving ...
- Feature Comparison Chart Software | Process Flowchart ...
- Feature Comparison Chart Software | Bar Chart Template for Word ...
- Comparison charts - Vector stencils library | Time series charts ...
- Basic Flowchart Symbols and Meaning | Design elements ...
- Dashboard Pie Chart Compare
- Samples Of Comparison Images
- Comparison Dashboard | Feature Comparison Chart Software ...
- Comparison charts - Vector stencils library
- Flowchart Example: Flow Chart of Marketing Analysis | Marketing ...
- ERD | Entity Relationship Diagrams, ERD Software for Mac and Win
- Flowchart | Basic Flowchart Symbols and Meaning
- Flowchart | Flowchart Design - Symbols, Shapes, Stencils and Icons
- Flowchart | Flow Chart Symbols
- Electrical | Electrical Drawing - Wiring and Circuits Schematics
- Flowchart | Common Flowchart Symbols
- Flowchart | Common Flowchart Symbols