Pictorial Chart

Sample Pictorial Chart. Sample Infographics

Use Pictorial Infographics solution to draw your own design pictorial infographics documents quick and easy.
This pictorial chart sample shows the population growth by continent in 2010-2013.
"Population growth' refers to the growth in human populations. Global population growth is around 80 million annually, or 1.2% p.a. The global population has grown from 1 billion in 1800 to 7 billion in 2012. It is expected to keep growing to reach 11 billion by the end of the century. Most of the growth occurs in the nations with the most poverty, showing the direct link between high population growth and low standards of living. The nations with high standards of living generally have low or zero rates of population growth. Australia's population growth is around 400,000 annually, or 1.8% p.a., which is nearly double the global average. It is caused mainly by very high immigration of around 200,000 p.a., the highest immigration rate in the world. Australia remains the only nation in the world with both high population growth and high standards of living." [Population growth. Wikipedia]
The image chart example "Population growth by continent, 2010 - 2013" was created using the ConceptDraw PRO diagramming and vector drawing software extended with the Basic Picture Graphs solution from the Graphs and Charts area of ConceptDraw Solution Park.
Image chart

Infographic Maker

Geo Map — United States of America Map

ConceptDraw is idea to draw the geological map of the United States of America from the pre-designed vector geo map shapes.
Each map is scaled, with the option to add further levels of detail - county borders, their names, capitals and major cities can be shown or hidden using the action menu for each state map. ConceptDraw DIAGRAM gives you full control over map size, shading, color fills and alignment.
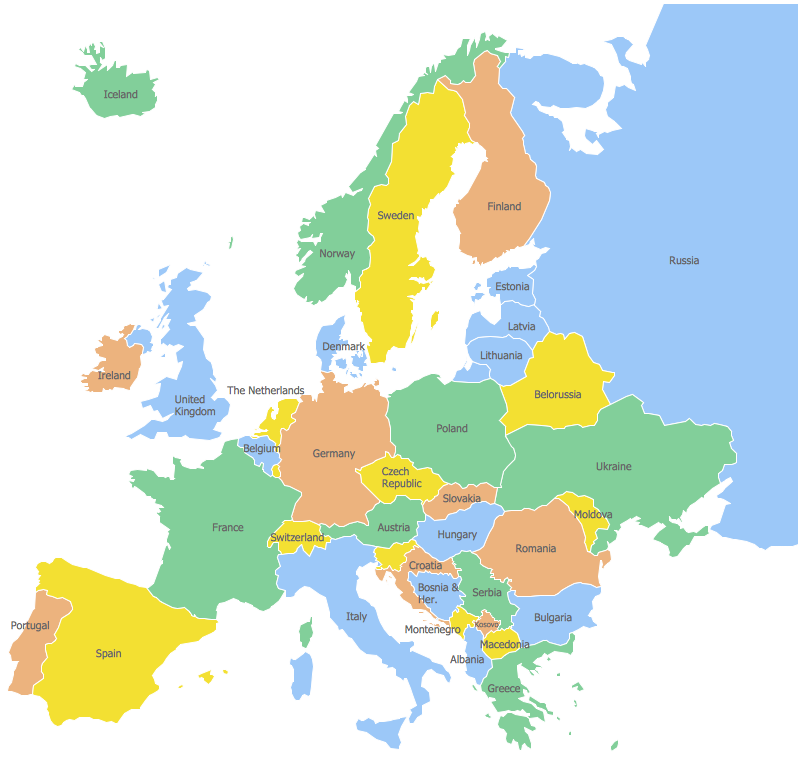
Use the Continent Maps solution for easy drawing professional looking geological maps, thematic maps, geospatial infographics and vector illustrations for your business documents, presentations and websites.
How to Draw Pictorial Chart. How to Use Infograms

Pictorial Infographics solution contains large number of libraries with variety of predesigned vector pictograms that allows you design infographics in minutes. There are available 10 libraries with 197 vector pictograms.
Geo Map — USA — Wisconsin

The vector stencils library Wisconsin contains contours for ConceptDraw DIAGRAM diagramming and vector drawing software. This library is contained in the Continent Maps solution from Maps area of ConceptDraw Solution Park.
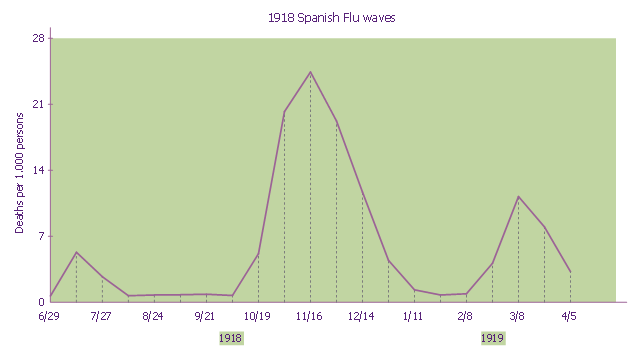
This line graph sample shows three pandemic waves: weekly combined influenza and pneumonia mortality, United Kingdom, 1918–1919. It was designed on the base of the Wikimedia Commons file: 1918 spanish flu waves.gif. [commons.wikimedia.org/ wiki/ File:1918_ spanish_ flu_ waves.gif]
"The 1918 flu pandemic (January 1918 – December 1920) was an unusually deadly influenza pandemic, the first of the two pandemics involving H1N1 influenza virus. It infected 500 million people across the world, including remote Pacific islands and the Arctic, and resulted in the deaths of 50 to 100 million (three to five percent of the world's population), making it one of the deadliest natural disasters in human history." [1918 flu pandemic. Wikipedia]
The line chart example "1918 Spanish Flu waves" was created using the ConceptDraw PRO diagramming and vector drawing software extended with the Line Graphs solution from the Graphs and Charts area of ConceptDraw Solution Park.
Line chart
Geo Map of Americas
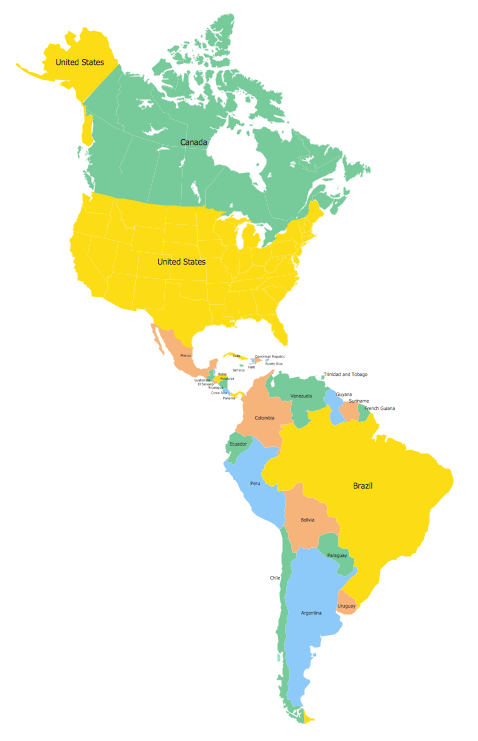
ConceptDraw is idea to draw the geological maps of America from the pre-designed vector geo map shapes and vector images map of america.
Use Continent Maps solution from the Maps area of ConceptDraw Solution Park to draw thematic maps, geospatial infographics and vector illustrations for your business documents, presentations and websites.
Geo Map — Europe
- World Population Chart Drawing
- Images On World Population For Chart Making
- Example Of Chart Diagram Of Showing World Population
- World Population Draw Diagram
- Geo Map - Asia | Pictures of Graphs | Picture Graph | World ...
- World Population Draw
- World Population Infographics
- World Population Infographics | Sample Pictorial Chart . Sample ...
- Chart On World Population For Drawing
- World Population Bar Graph Images
- Drawing About Growing Population
- Picture Graph | Pictures of Graphs | Geo Map - Asia | World ...
- Population Chart Drawing
- Line Chart Examples | Basic Diagramming | Line Graph | Population ...
- Line Chart Examples | Population growth by continent | San ...
- Simple Drawing On Population Growth
- Easy Drawing Of Population
- World Population Infographics | Sample Pictorial Chart Sample ...
- An Easy Diagram Of Population
- World Population Infographics | Population growth by continent ...
- ERD | Entity Relationship Diagrams, ERD Software for Mac and Win
- Flowchart | Basic Flowchart Symbols and Meaning
- Flowchart | Flowchart Design - Symbols, Shapes, Stencils and Icons
- Flowchart | Flow Chart Symbols
- Electrical | Electrical Drawing - Wiring and Circuits Schematics
- Flowchart | Common Flowchart Symbols
- Flowchart | Common Flowchart Symbols