This site uses cookies. By continuing to browse the ConceptDraw site you are agreeing to our Use of Site Cookies.

entity-relationship diagram, ER-diagram, database ERD Entity-Relationship Diagram (ERD)

entity-relationship diagram, ER-diagram, database ERD
Entity-Relationship Diagram (ERD) solution extends ConceptDraw DIAGRAM software with templates, samples and libraries of vector stencils from drawing the ER-diagrams by Chen's and crow’s foot notations.
"Crow's Foot notation is used in Barker's Notation, SSADM and Information Engineering. Crow's Foot diagrams represent entities as boxes, and relationships as lines between the boxes. Different shapes at the ends of these lines represent the cardinality of the relationship." [Entity–relationship model. Wikipedia]
The vector stencils library ERD, crow's foot notation contains 18 symbols for creating the ER-diagrams using the ConceptDraw PRO diagramming nd vector drawing software.
The example"Design elements - ERD solution (crow's foot notation)" is included in the Entity-Relationship Diagram (ERD) solution from the Software Development area of ConceptDraw Solution Park.
Crow's foot ERD
Crow's foot ERD, entity,
HelpDesk

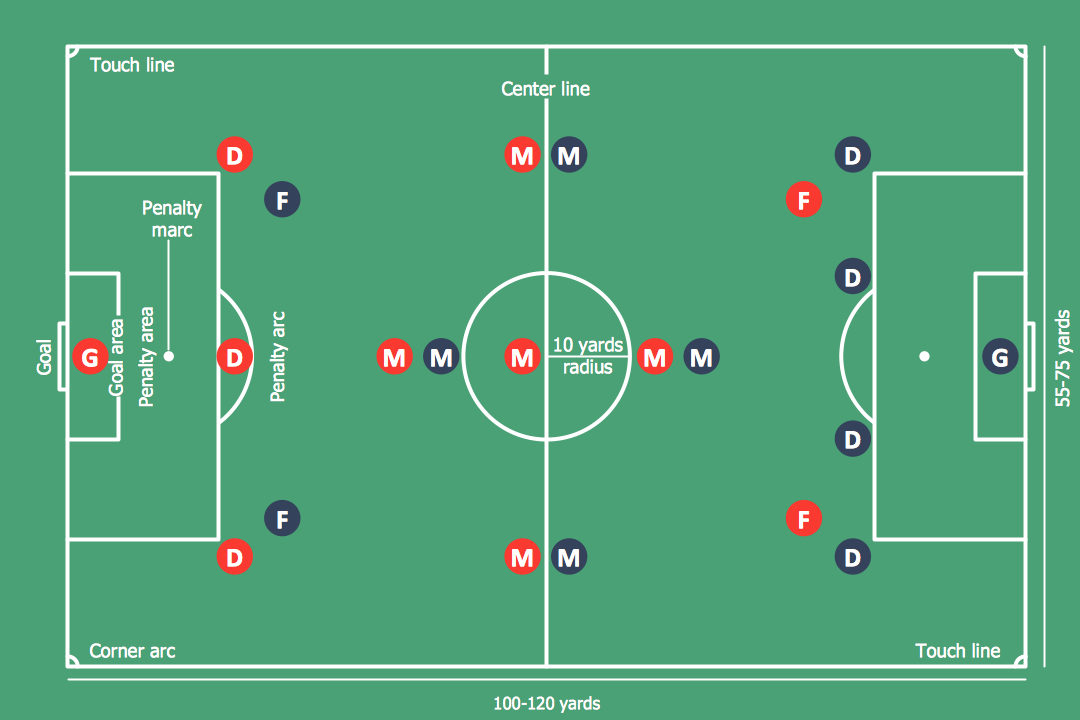
How to Make Soccer Position Diagram

The soccer field has the form of a large rectangle, covered with grass. Dimensions of soccer fields may vary slightly, depending on the level of the game, but all fields have some common characteristics. Soccer players may take different positions. Each soccer position has its own name and implies certain player functions. Every soccer position has a very specific name and task: Goalkeeper, Defenders, Midfielders and Forwards. During preparation for the game, coach met a challenge: how to explain each player's position and his role in the game. The difficulty is the fact that in the course of the game players will often move on the field and do not stay in one place. Football field diagram with dimensions and marking, and positions - it is an important tool for the coach. ConceptDraw DIAGRAM helps both coach and players to understand exactly their roles during the particular game. The ability to create Soccer diagrams is contained in the ConceptDraw Soccer solution. The solution provides
HelpDesk

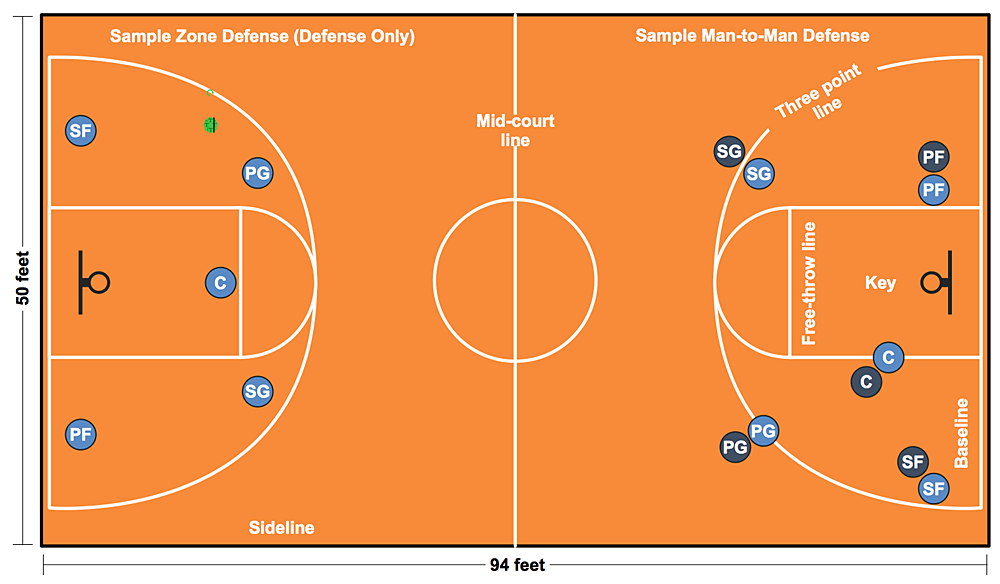
How to Make a Basketball Court Diagram

Basketball Court diagrams are often used as a teaching and learning tool for coaches, players and parents to describe the basketball moves and shooting drills. The ability to create Basketball diagrams with ConceptDraw DIAGRAM is contained in the Basketball solution. It provides a set of special tools for creating different Basketball diagrams. Basketball court diagram is used to describe basketball moves and shooting drills during the discussion of the match, as well as to develop a winning defense and attack strategy as a clear visual plan for future games.
HelpDesk

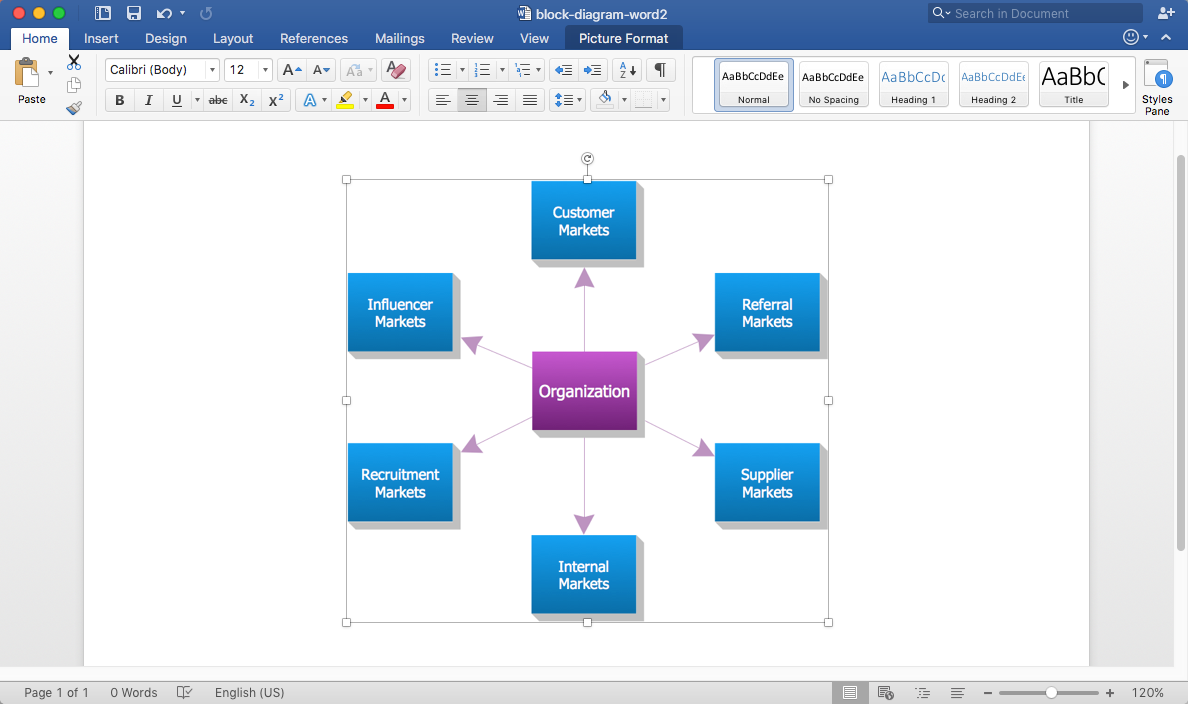
How to Add a Block Diagram to an MS Word ™ Document

Block diagram consists of graphic blocks. Blocks are connected by lines or arrows. Block diagrams are used to show the relationship between parts of some systems. It can be used for the development of new systems or to improve existing ones. The structure of the block diagram gives a high-level overview of the major components of the system, as well as the important relationships. Using the block diagrams, you can more effectively present the business data contained in your MS Word documents. ConceptDraw DIAGRAM allows you to easily create block diagrams and then insert them into an MS Word document.
HelpDesk

How to Create a BPMN Diagram

Business Process Modeling Notation (BPMN) is a method of illustrating business processes in the form of a diagram. The most effective method of creating or analyzing a business process is to visually interpret the steps using a business process diagram, flowchart or workflow. This is known as business process modeling and will be performed within a company by a team who have detailed knowledge of company process, and analysts with expertise in the modeling discipline. The objective is often to increase production or lower costs — by modeling the process initially using a flowchart, inefficiencies and problems can be spotted before committing to a decision or strategy. You can create BPMN diagrams using the ConceptDraw DIAGRAM diagramming tools. ConceptDraw has designed a solution that combines BPMN v2.0 methodology and graphical notification into one powerful package. The Business Process Diagrams solution from ConceptDraw Solution Park provides a comprehensive collection of vector
HelpDesk

How to Create a Picture Graph

Picture Graphs are used commonly to represent non-complex data to a large audience. A Picture Graph is a simple kind of marketing diagram used to show the relationship among various quantities. It includes pictures or symbols to represent information visually. There are many cases when you have just some numbers to show and compare. This is not a reason to not use visual tools. You can produce a simple picture graph using memorable symbols to get the best visual presentation. Using specific symbols instead of regular colored bars makes picture graphs a much more descriptive tool. You can use tools from an existing library or find appropriate clipart in ConceptDraw’s collection. ConceptDraw DIAGRAM allows you to draw a simple and easy to understand Picture Charts using the special library.

Software development with ConceptDraw DIAGRAM

ConceptDraw possesses powerful tools for designing of technical documentation for object-oriented projects. The libraries included in the package allow to easily draw class hierarchies, object hierarchies and diagrams of data flows with the use of the most popular notations, including UML and Booch notations.
HelpDesk

How to Create a Concept Map

The graphical technique of knowledge representation in the form of structured networks of concepts (ideas) is called concept mapping. Concept network consists of shapes that represent concepts and connectors representing relationships between concepts. The difference between mind maps and concept maps is that a mind map has only one object depicting the main idea, while a concept map may have several. Concept mapping is used to structure ideas, to communicate a complex system of knowledge, to help the learning process, etc. ConceptDraw DIAGRAM allows you to draw concept maps using the Concept Map solution.
HelpDesk

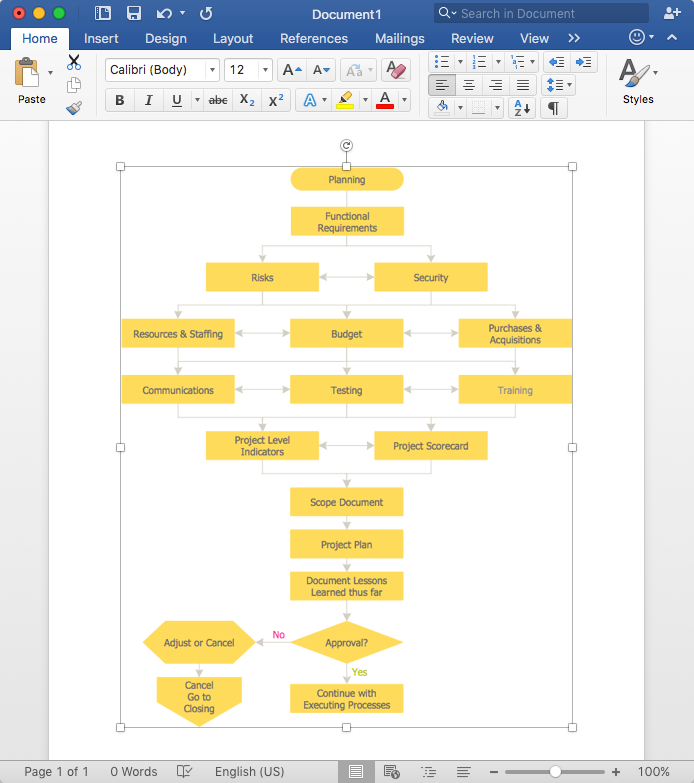
How to Add a Flowchart to MS Word Document

ConceptDraw DIAGRAM allows you to easily create flowcharts and then insert them into a MS Word document.
HelpDesk

How to Draw a Pie Chart

A pie chart represents data, in a clear and easy to read around (pie) form. A circular pie chart is divided into sections (slice). Each "slice" depicts the It reflects the proportion of each component in the whole "pie". This type of chart is most often used for the visualization of statistical data. That is why pie charts are widely used in marketing. As the pie charts show proportional parts of a whole, they are good for various visual comparisons. For example, it is difficult to imagine a more intuitive way to show segmentation and market share. ConceptDraw DIAGRAM allows you to draw a simple and clear Pie Chart using the Pie Charts solution.