Pictorial Chart

Sample Pictorial Chart. Sample Infographics
")
Use Pictorial Infographics solution to draw your own design pictorial infographics documents quick and easy.
Infographic Maker

Pyramid Diagram

This pictorial chart sample shows the population growth by continent in 2010-2013.
"Population growth' refers to the growth in human populations. Global population growth is around 80 million annually, or 1.2% p.a. The global population has grown from 1 billion in 1800 to 7 billion in 2012. It is expected to keep growing to reach 11 billion by the end of the century. Most of the growth occurs in the nations with the most poverty, showing the direct link between high population growth and low standards of living. The nations with high standards of living generally have low or zero rates of population growth. Australia's population growth is around 400,000 annually, or 1.8% p.a., which is nearly double the global average. It is caused mainly by very high immigration of around 200,000 p.a., the highest immigration rate in the world. Australia remains the only nation in the world with both high population growth and high standards of living." [Population growth. Wikipedia]
The image chart example "Population growth by continent, 2010 - 2013" was created using the ConceptDraw PRO diagramming and vector drawing software extended with the Basic Picture Graphs solution from the Graphs and Charts area of ConceptDraw Solution Park.
Image chart

Line Chart Examples

Line Graph

Chart Examples

What Is a Line Chart

Chart Templates

Geo Map - Asia

Use Geo Map Asia to draw thematic maps, geospatial infographics and vector illustrations for your business documents, presentations and websites.
Bar Graph

Area Chart

Geo Map - Africa
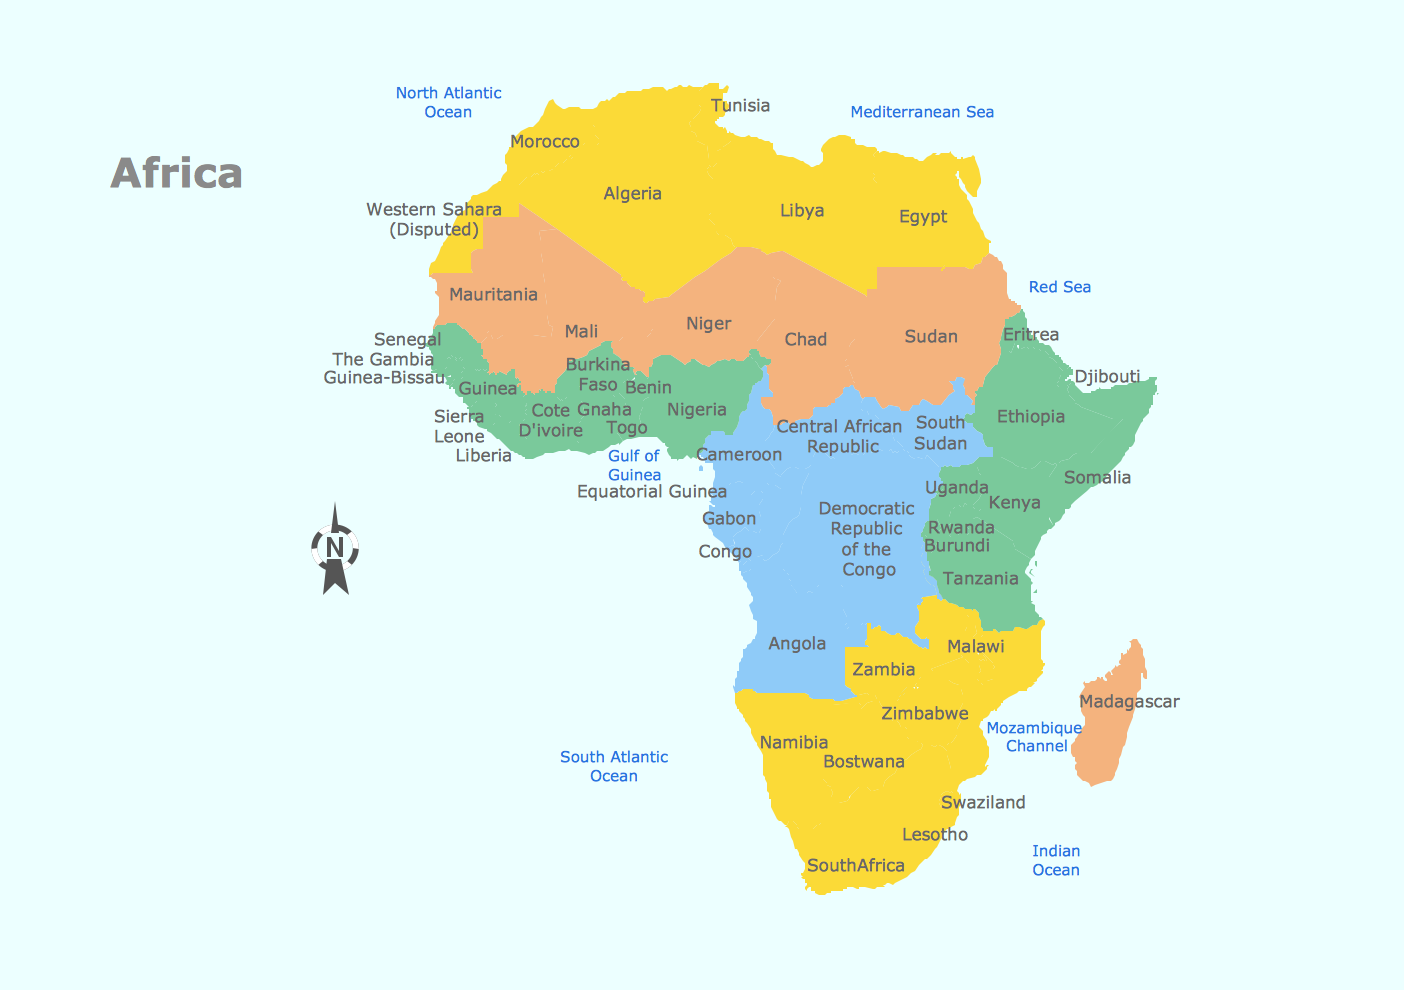
Vector design elements library Africa contains country map contours, geographical maps, cartograms and thematic maps for ConceptDraw PRO diagramming and vector drawing software. To help visualize the business and thematic information connected with geographic areas, locations or customs.
All ConceptDraw PRO documents are vector graphic files and are available for reviewing, modifying, and converting to a variety of formats: image, HTML, PDF file, MS PowerPoint Presentation, Adobe Flash, MS Visio (.VDX, .VSDX).
- World Population Chart Drawing
- World Population Draw Diagram
- Images On World Population For Chart Making
- Example Of Chart Diagram Of Showing World Population
- World Population Infographics
- Geo Map - Asia | Pictures of Graphs | Picture Graph | World ...
- Picture Graph | Pictures of Graphs | Geo Map - Asia | World ...
- Drawing Of World Population Map
- Population Chart Drawing
- Pictograms Of World Population
- Drawing About Growing Population
- An Easy Diagram Of Population
- Line Chart Examples | San Francisco population history | Regional ...
- World Population Infographics | Sample Pictorial Chart Sample ...
- Population Easy Drawing
- Population Of World Flow Chart
- World Population Bar Graph Images
- Simple Drawing On Population Growth
- Easy Drawing Of Population
- Line Chart Examples | Infographic Maker | Pyramid Diagram ...
- ERD | Entity Relationship Diagrams, ERD Software for Mac and Win
- Flowchart | Basic Flowchart Symbols and Meaning
- Flowchart | Flowchart Design - Symbols, Shapes, Stencils and Icons
- Flowchart | Flow Chart Symbols
- Electrical | Electrical Drawing - Wiring and Circuits Schematics
- Flowchart | Common Flowchart Symbols
- Flowchart | Common Flowchart Symbols