Pyramid Chart Examples

Pyramid Diagram

ERD Symbols and Meanings

The Chen's ERD notation is still used and is considered to present a more detailed way of representing entities and relationships.
To create an ERD, software engineers mainly turn to dedicated drawing software, which contain the full notation resources for their specific database design - ERD symbols and meanings. CS Odessa has released an all-inclusive Entity-Relationship Diagram (ERD) solution for their powerful drawing program, ConceptDraw DIAGRAM.

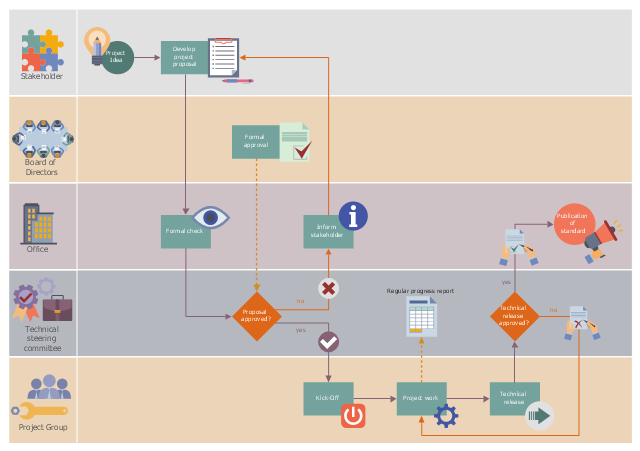
This workflow diagram example was designed on the base of the Wikimedia Commons file: ASAM e.V. flowchart.png.
"Life cycle of an ASAM standard." [commons.wikimedia.org/ wiki/ File:ASAM_ e.V._ flowchart.png]
This file is licensed under the Creative Commons Attribution-Share Alike 3.0 Unported license. [creativecommons.org/ licenses/ by-sa/ 3.0/ deed.en]
"Association for Standardization of Automation and Measuring Systems or ASAM is an incorporated association under German law. Its members are primarily international car manufacturers, suppliers and engineering service providers from the automotive industry. The association coordinates the development of technical standards, which are developed by working groups composed of experts from its member companies. ASAM pursues the vision that the tools of a development process chain can be freely interconnected and allow a seamless exchange of data. The standards define protocols, data models, file formats and application programming interfaces (APIs) for the use in the development and testing of automotive electronic control units." [Association for Standardisation of Automation and Measuring Systems. Wikipedia]
The workflow diagram example "Life cycle of an ASAM standard" was created using ConceptDraw PRO software extended with the Business Process Workflow Diagrams solution from the Business Processes area of ConceptDraw Solution Park.
Workflow diagram
Cloud Computing Architecture Diagrams

Pyramid Diagram

Cross-Functional Flowchart

Use cross-functional flowcharts to show the relationship between a business process and the functional units (such as departments) responsible for that process. To create it use the best flowchart maker of ConceptDraw DIAGRAM.

Hybrid Network Topology

This is example of the Hybrid network topology.
Network topology is the topological structure of the computer network. There are many types of the network topologies: bus, star, ring, mesh topology, but the most popular is the hybrid topology.
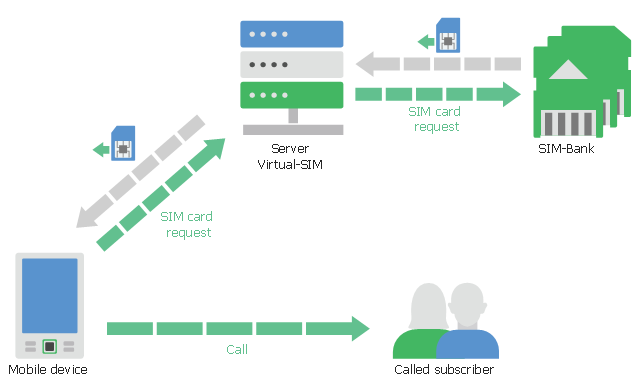
This telecommunication diagram sample shows the virtual-SIM principle of operation. It was designed on the base of Wikimedia Commons file: Схема-работы-Virtual-SIM.jpg.
[commons.wikimedia.org/ wiki/ File:%D0%A1%D1%85%D0%B5%D0%BC%D0%B0-%D1%80%D0%B0%D0%B1%D0%BE%D1%82%D1%8B-Virtual-SIM.jpg]
This file is licensed under the Creative Commons Attribution-Share Alike 4.0 International license. [creativecommons.org/ licenses/ by-sa/ 4.0/ deed.en]
Virtual SIM is technical solution of SIM card virtualization. It provides remote online access to the SIM card by means of additional equipment as modem with voice access or additional mobile device. [ru.wikipedia.org/ wiki/ Virtual_ sim]
The telecom diagram example "Virtual-SIM principle of operation" was created using the ConceptDraw PRO diagramming and vector drawing software extended with the Computers and Communications solution from the Illustration area of ConceptDraw Solution Park.
Telecom diagram
Gane Sarson Diagram

- Wiki Flowchart Symbols
- Lead to opportunity sales flow | Process flow diagram - Typical oil ...
- Crude oil distillation unit - PFD | Process flow diagram (PFD ...
- Workflow Management Wiki
- Element Of Flowchart Wikipedia
- Object Oriented Dfd Wiki
- Pert Diagram Wiki
- Bubble Diagram Wiki
- Block diagram - Gap model of service quality | Block Diagram ...
- Pfd Process Flow Diagram
- ERD | Entity Relationship Diagrams, ERD Software for Mac and Win
- Flowchart | Basic Flowchart Symbols and Meaning
- Flowchart | Flowchart Design - Symbols, Shapes, Stencils and Icons
- Flowchart | Flow Chart Symbols
- Electrical | Electrical Drawing - Wiring and Circuits Schematics
- Flowchart | Common Flowchart Symbols
- Flowchart | Common Flowchart Symbols