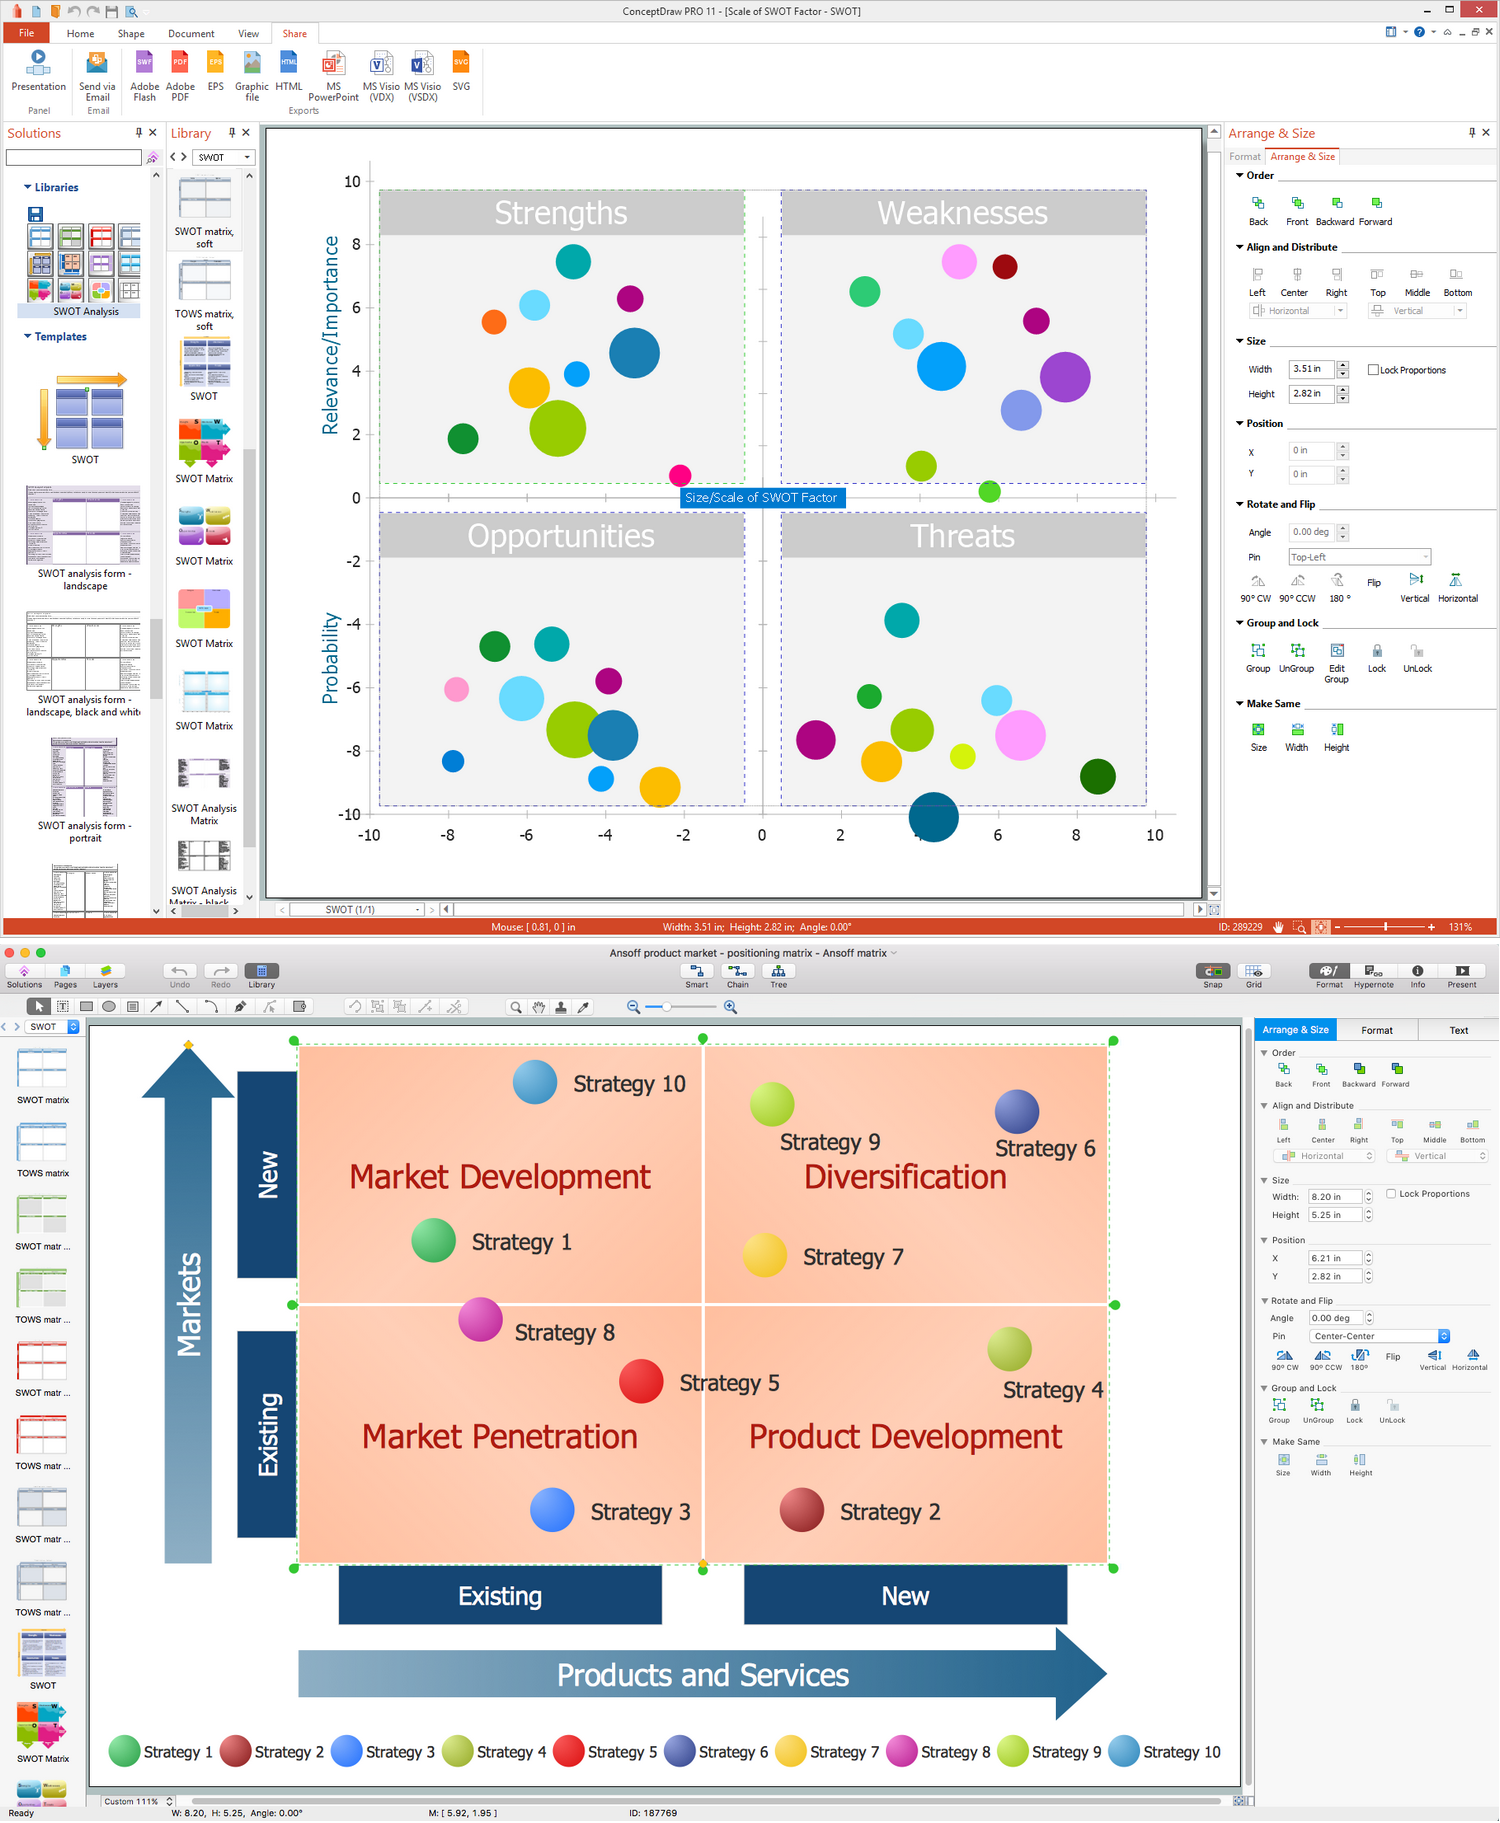
SWOT Matrix
SWOT matrix is a structured planning method used to evaluate the strengths, weaknesses, opportunities and threats involved in a project or in a business venture. ConceptDraw PRO diagramming and vector drawing software extended with SWOT and TOWS Matrix Diagrams Solution from the Management Area will help you design SWOT Matrix of any complexity quick and easy.SWOT Matrix Software
The SWOT Analysis solution from the Management area of ConceptDraw Solution Park contains set of examples, templates and vector design elements of SWOT and TOWS matrices. It helps you to quickly draw SWOT and TOWS analysis matrix diagrams using the best SWOT matrix software ConceptDraw PRO.Ansoff Matrix
ConceptDraw PRO software extended with Matrices Solution from the Marketing Area of ConceptDraw Solution Park offers you the possibility to develop the Ansoff Matrix of any complexity.Growth-Share Matrix Software
Growth-Share Matrix Software - ConceptDraw PRO is a powerful diagramming and vector drawing software for creating professional looking Growth–Share Matrices. For simple and quick creating the Growth–Share Matrix ConceptDraw PRO offers the Matrices Solution from the Marketing Area of ConceptDraw Solution Park.The Matrices Solution also provides a wide variety of templates and samples that will help you to create the Matrix diagrams of any difficulty.
Porter's Value Chain
The available pre-made examples of the matrices, including the Porter's Value Chain’s one can be found in the mentioned solution. It also allows creating an Ansoff matrix, a BCG matrix, a Competitive strategies matrix, a Four-quadrant matrix, a Chore chart, a Flow process chart, a Quality function deployment matrix, a Positioning map and Porter’s generic strategies matrix being based on the templates given within the Matrices solution.
 Event-driven Process Chain Diagrams
Event-driven Process Chain (EPC) Diagram is a type of flowchart widely used for modeling in business engineering and reengineering, business process improvement, and analysis. EPC method was developed within the Architecture of Integrated Information Systems (ARIS) framework.
Venn Diagram Examples for Problem Solving. Environmental Social Science. Human Sustainability Confluence
The Venn diagram example below shows sustainable development at the confluence of three constituent parts.Create your Venn diagrams for problem solving in environmental social science using the ConceptDraw PRO diagramming and vector drawing software extended with the Venn Diagrams solution from the area "Diagrams" of ConceptDraw Solution Park.
 People
This solution extends ConceptDraw PRO software with samples, templates and libraries of vector clipart for drawing the People illustrations. Use it to make professional-looking documents, presentations and websites illustrated with color scalable vector c
PDPC
ConceptDraw PRO extended with Seven Management and Planning Tools Solution from the Management Area of ConceptDraw Solution Park is the best software for drawing all types of diagrams from the Seven Management and Planning Tools: Affinity Diagram, Relations Diagram, Prioritization Matrix, Root Cause Analysis Tree Diagram, Involvement Matrix, PERT Chart, and Risk Diagram (PDPC).Internal Audit Process
Internal auditing is an independent, objective assurance and consulting activity designed to add value and improve an organization's operations.ConceptDraw PRO diagramming and vector drawing software extended with Audit Flowcharts solution from the Finance and Accounting area perfectly suits for the Internal Audit Process. You can make sure this right now!
 Winter Sports
The Winter Sports solution from Sport area of ConceptDraw Solution Park contains winter sports illustration examples, templates and vector clipart libraries.
Cross-Functional Flowchart
Cross-Functional Flowchart - to draw cross functional process maps is by starting with a cross-functional flowchart samples and templates. Easy to draw sample cross functional Process Flow Diagrams. Using a Cross-Functional flowchart is a clear way of showing each team member’s responsibilities and how processes get shared or transferred between different teams and departments.Use cross-functional flowcharts to show the relationship between a business process and the functional units (such as departments) responsible for that process. To create it use the best flowchart maker of ConceptDraw PRO.

Ice Hockey Diagram – Penalty Kill Forecheck Angling Drill
ConceptDraw Ice Hockey solution is a good tool to think about complex things. You don't need a software during hockey match, of course. Drawing software helps to plan strategy and tactics before a match, and then analyze mistakes and results.Offensive Strategy — Spread Offense Diagram
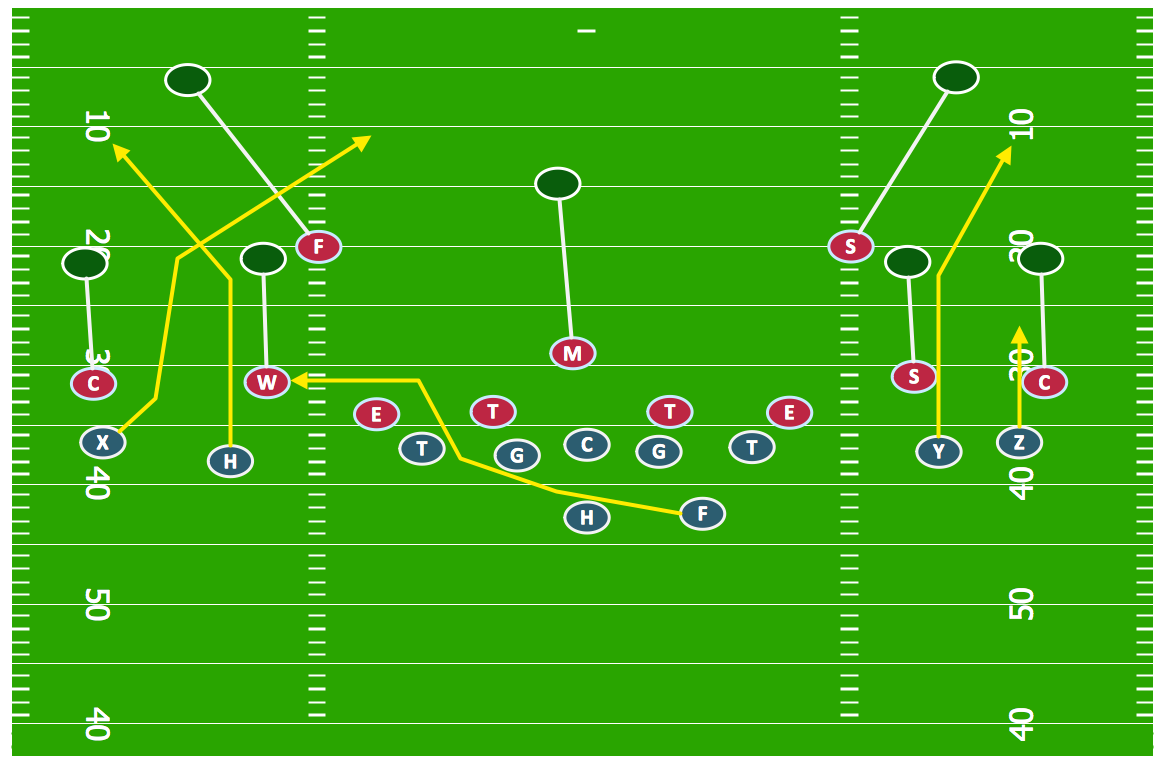
Explaining offensive strategies of American Football is practically impossible without drawing a diagram. If you need to do this more than once you have to choose an appropriate tool allows you to change diagrams easily. ConceptDraw PRO extended with the Football Solution is the best choice for this case.Visualize Stakeholder Analysis
Stakeholder analysis in conflict resolution, project management, and business administration, is the process of identifying the individuals or groups that are likely to affect or be affected by a proposed action, and sorting them according to their impact on the action and the impact the action will have on them.Use the ConceptDraw PRO diagramming and vector drawing software enhanced with powerful tools of Stakeholder Onion Diagrams Solution from the Management Area of ConceptDraw Solution Park to easy and effectively visualize stakeholder analysis.
- Tows Matrix Wikipedia
- SWOT analysis matrix diagram templates | SWOT Template | SWOT ...
- SWOT analysis matrix diagram - Instructional sample | SWOT ...
- Matrix Diagram Wikipedia
- Challenges For Sustainable Development Wiki
- Pyramid Diagram | Winter Sports | SWOT Matrix | Joint Bar Graph ...
- SWOT Matrix Template | TOWS analysis matrix - Template ...
- T Joint Wikipedia
- Authority Matrix Diagram Software | Porter's value chain matrix ...
- SWOT Matrix Template | Swot Analysis Examples | SWOT Analysis ...
- Challenges To Sustainable Development Wikipedia Com
- Boston growth-share (BCG) matrix diagram | SWOT analysis matrix ...
- Porter's generic strategies matrix diagram | Competitor Analysis ...
- Porter's generic strategies matrix diagram | Competitive strategy ...
- Positioning Map | SWOT analysis positioning matrix - Template ...
- SWOT analysis positioning matrix - Template | Positioning map ...
- Porter's value chain matrix diagram
- High level fault tree | SWOT and TOWS Matrix Diagrams | Data ...
- Boston growth-share (BCG) matrix diagram | Matrices | SWOT ...
- Responsibility assignment matrix - Central statistical office ...
- ERD | Entity Relationship Diagrams, ERD Software for Mac and Win
- Flowchart | Basic Flowchart Symbols and Meaning
- Flowchart | Flowchart Design - Symbols, Shapes, Stencils and Icons
- Flowchart | Flow Chart Symbols
- Electrical | Electrical Drawing - Wiring and Circuits Schematics
- Flowchart | Common Flowchart Symbols
- Flowchart | Common Flowchart Symbols


