Best Value — Total Quality Management
The Total Quality Management Diagram solution helps your organization visualize business and industrial processes. Create Total Quality Management diagrams for business process with ConceptDraw software.
 Quality Mind Map
This solution extends ConceptDraw MINDMAP software with Quality Management Mind Maps (Presentations, Meeting Agendas, Problem to be solved).
Total Quality Management Value
The Total Quality Management Diagram solution helps you and your organization visualize business and industrial processes. Create Total Quality Management diagrams for business process with ConceptDraw software.Types of Flowcharts
A Flowchart is a graphically representation of the process, algorithm or the step-by-step solution of the problem. There are ten types of Flowcharts. Using the Flowcharts solution from the Diagrams area of ConceptDraw Solution Park you can easy and quickly design the Flowchart of any of these types.
ConceptDraw PRO Compatibility with MS Visio
For those who are migrating from MS Visio to ConceptDraw PRO, or for those who have colleagues and clients who use Visio, ConceptDraw PRO is compatible with MS Visio .VSDX formatted files..VSDX is Visio’s open XML file format, and it can be easily imported and exported by ConceptDraw PRO.How To Create a FlowChart using ConceptDraw
Have you ever needed a flowchart, but did not have the time or tools to build one? Rapid Draw allows you to build a professional flowchart quickly and easily. You have the ability to add your own shapes to Rapid Draw’s built in shape library.Stakeholder Mapping Tool
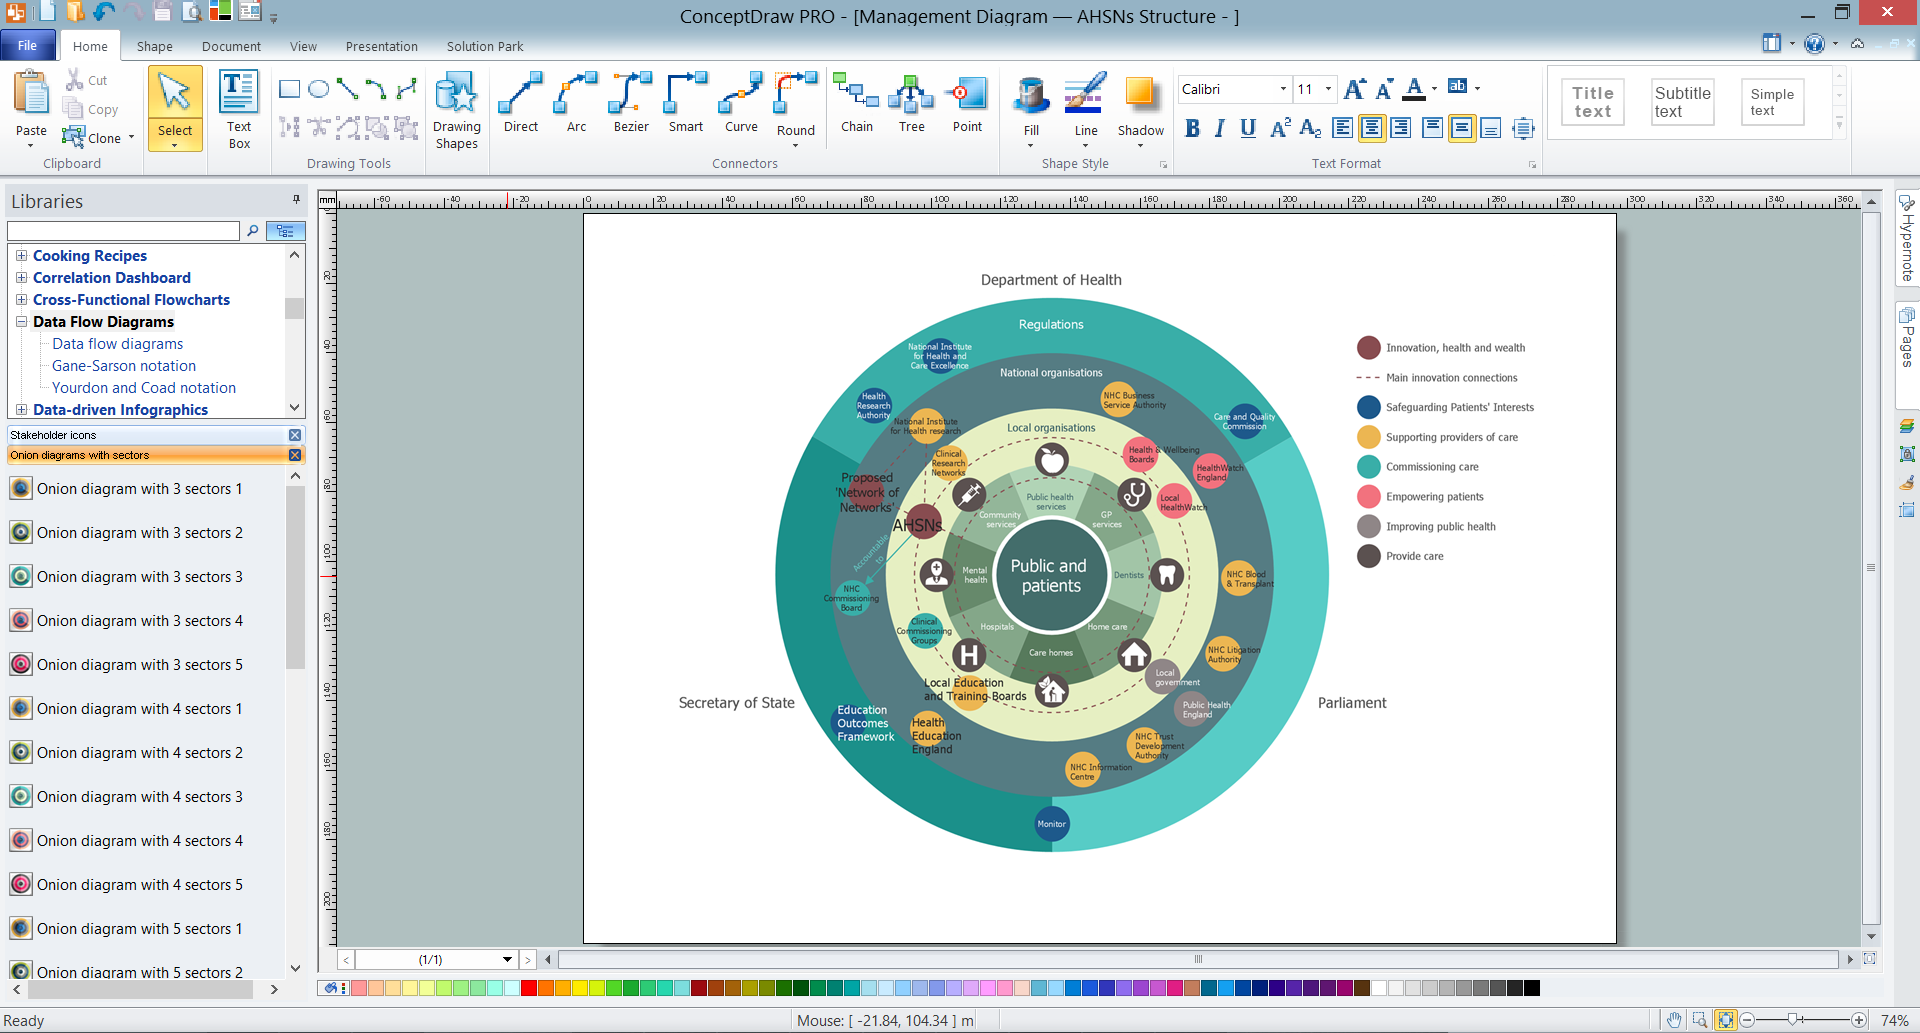
Stakeholders are the groups of people or organizations whose contribution matters to the organization's success, this can be labour participation, financial participation, dissemination of information about organization, etc. So, the employees of the company, its suppliers, customers, media, public organizations, state authorities, all they are stakeholders of the company.ConceptDraw PRO diagramming and vector drawing software extended with Stakeholder Onion Diagrams Solution from the Management Area of ConceptDraw Solution Park is a powerful stakeholder mapping tool which allows easy create Stakeholder Onion diagrams and maps depicting the layers of a project, relationships of stakeholders to a project goal, and relationships between stakeholders.
Types of Flowchart - Overview
When designing a process or an instruction in clear way, you should consider creating a flowchart. A Process Flow Diagram is the method. You can avoid wasting a lot of time understanding complex concepts as they get clear with different diagrams.
Process Flow Chart
A Process Flow Chart is a type of flowchart which is mostly used in industrial, chemical and process engineering for illustrating high-level processes, major plant processes and not shows minor details.ConceptDraw PRO diagramming and vector drawing software extended with Flowcharts Solution from the "Diagrams" Area of ConceptDraw Solution Park is the best way to create Process Flow Chart and other types of flowcharts.
Mind Map Food
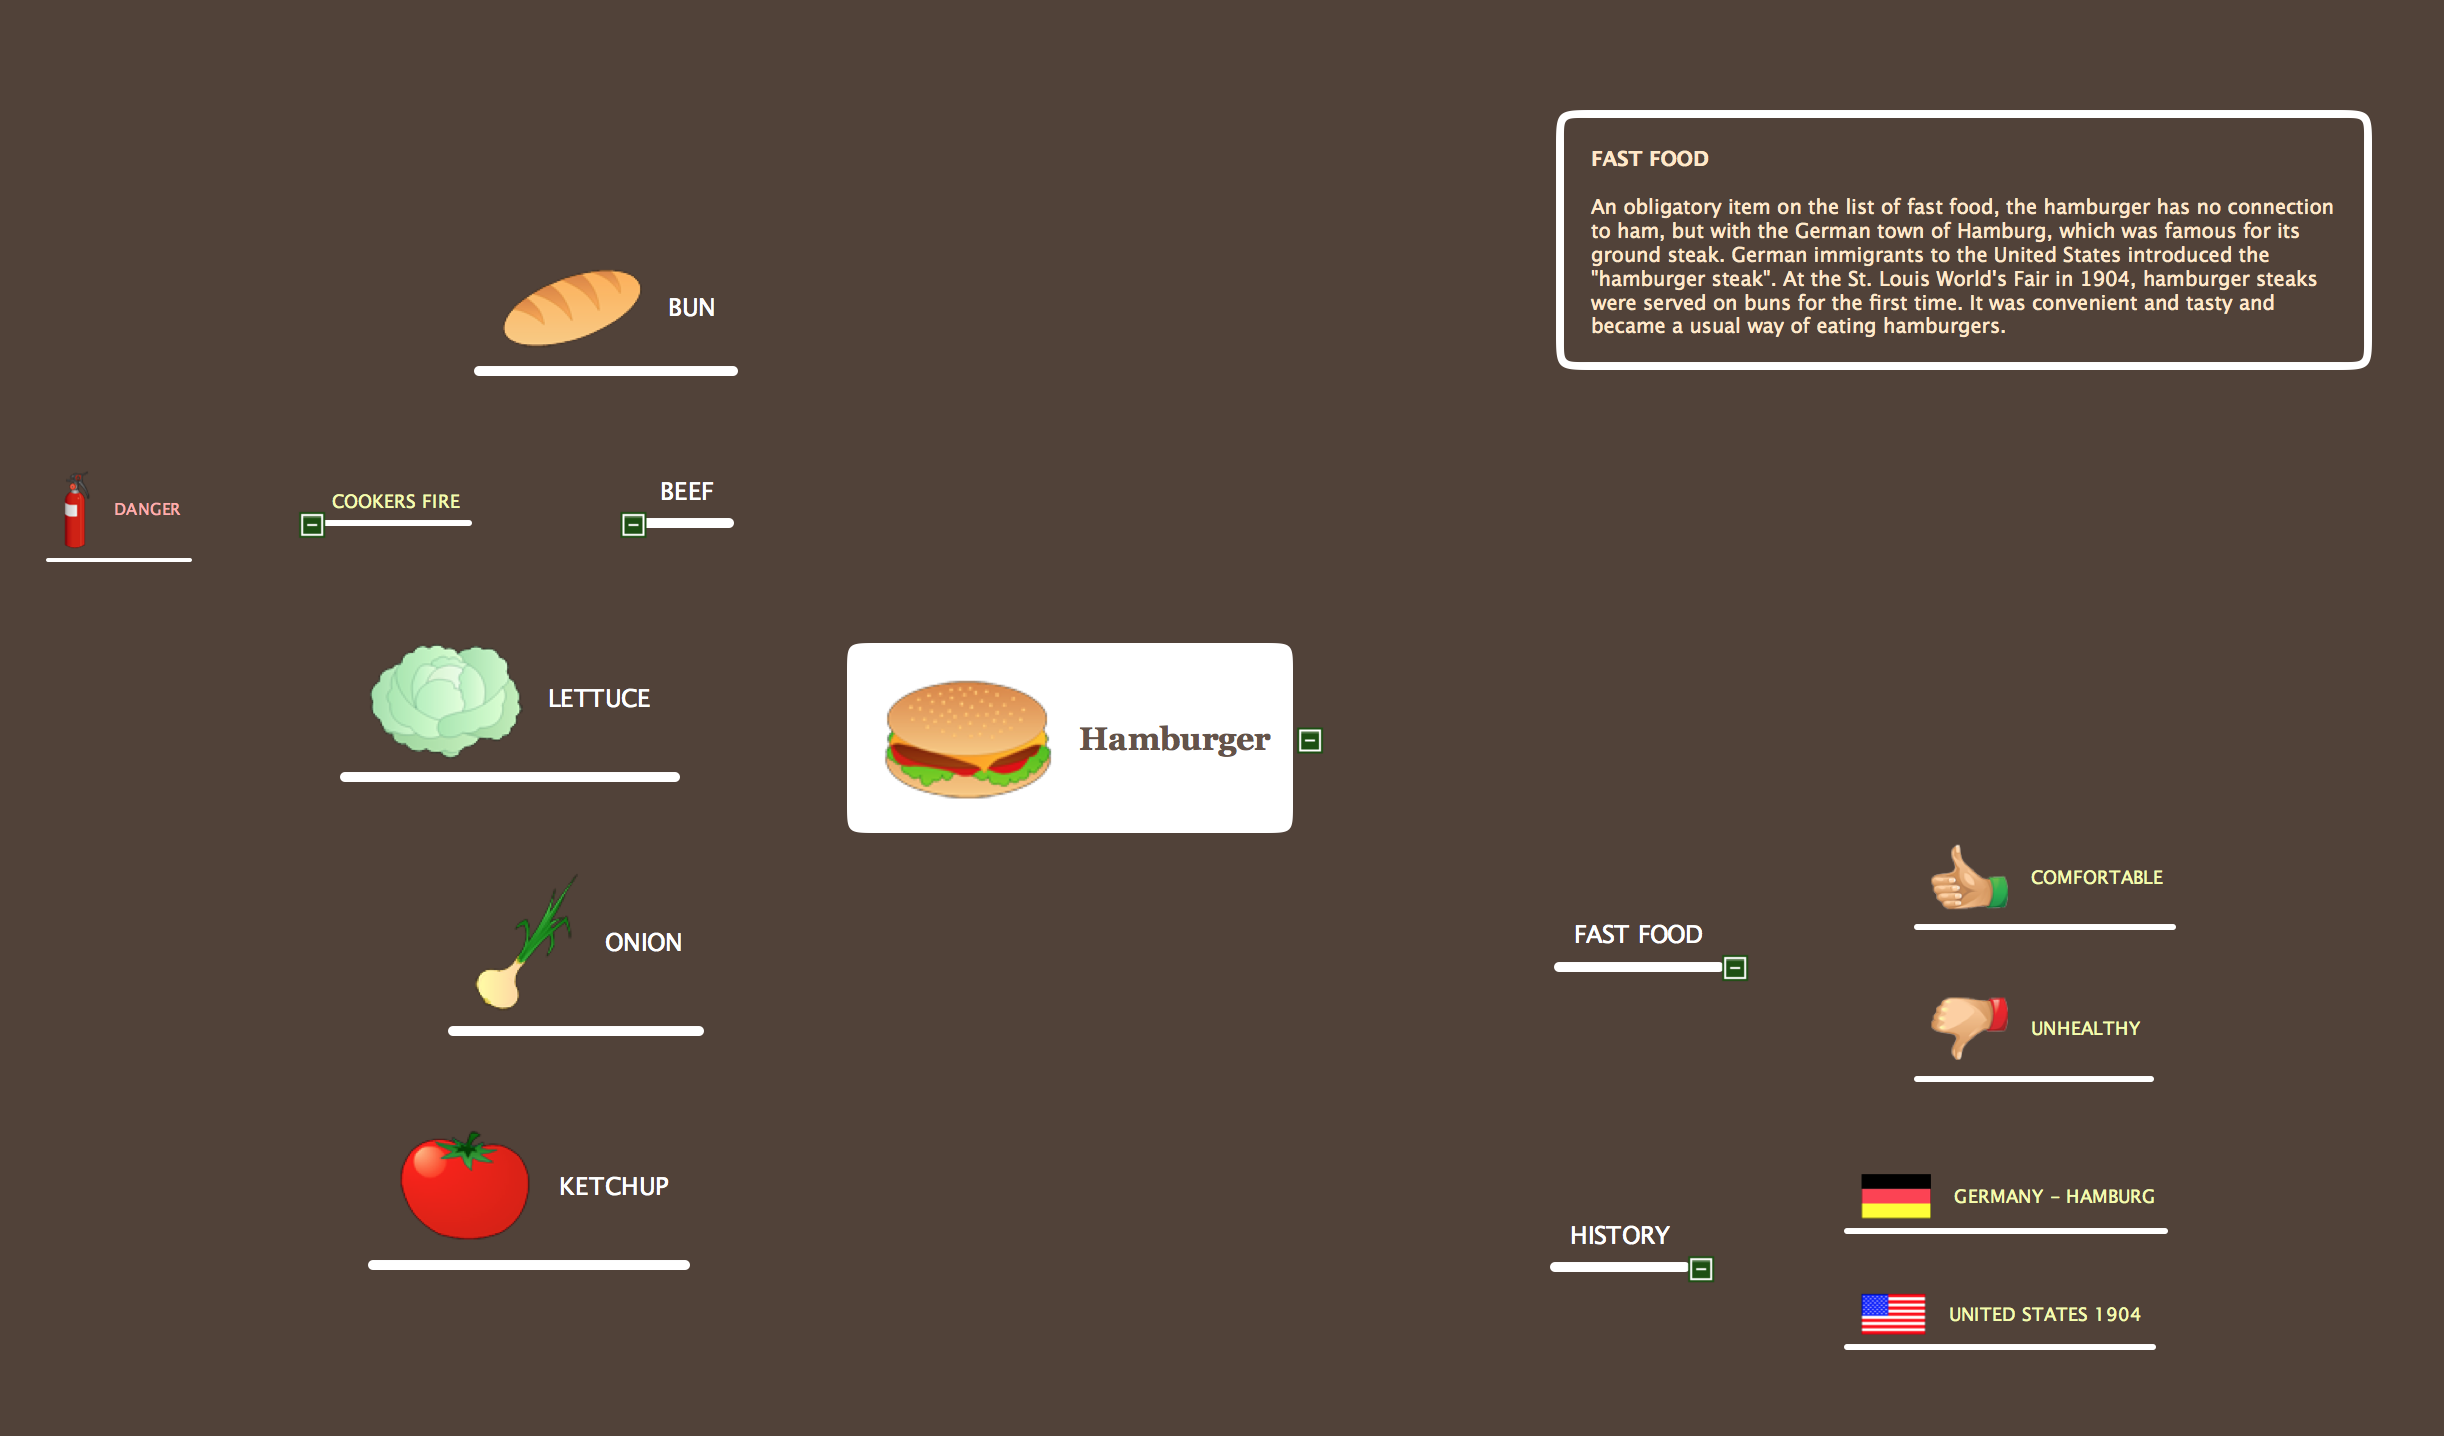
Mind Map Food - This sample was created with ConceptDraw MINDMAP mind mapping software.This sample shows the mind map about the such fast food as Hamburger. This sample narrates about the hamburger’s history, ingredients and preparation. You can use this sample at the cooking, in the fast food cafes, on the factories of the fast preparation products.
Performance Indicators
ConceptDraw PRO diagramming and vector drawing software offers the useful tools of the Sales Dashboard solution from the Marketing area for easy creating professional looking live dashboards which allow to track the business sales activity and progress thanks to representing the Key Performance Indicators (KPIs) on them.- The Purpose Of Vsm Is To And Eliminate Waste
- How to Create a VSM Diagram Using ConceptDraw Value Stream ...
- Sample Of Vsm
- Value Stream Mapping Symbols | Basic Flowchart Symbols and ...
- VSM | How to Create a VSM Diagram Using ConceptDraw Value ...
- Value Stream Mapping
- Value Stream Mapping Shipping
- Value-Stream Mapping for Manufacturing | Picture Graphs | Lean ...
- Process Flowchart | Auditing Process. Audit Planning Process | How ...
- Design elements - Day spa equipment layout plan | Value Stream ...
- Payroll process - Swim lane process mapping diagram | Design ...
- Buying Office Vsm Icon
- Value-Stream Mapping for Manufacturing | Process Flowchart | Mind ...
- Value stream map parts | Design elements - Value stream mapping ...
- How to Create a VSM Diagram Using ConceptDraw Value Stream ...
- Value-Stream Mapping for Manufacturing | Bar Diagrams for ...
- Process Flowchart | How to Create a VSM Diagram Using ...
- How To use House Electrical Plan Software | Value Stream Mapping ...
- Best Value Stream Mapping mac Software | Cross-Functional ...
- Process Flowchart | Cross-Functional Flowchart | Basic Flowchart ...
- ERD | Entity Relationship Diagrams, ERD Software for Mac and Win
- Flowchart | Basic Flowchart Symbols and Meaning
- Flowchart | Flowchart Design - Symbols, Shapes, Stencils and Icons
- Flowchart | Flow Chart Symbols
- Electrical | Electrical Drawing - Wiring and Circuits Schematics
- Flowchart | Common Flowchart Symbols
- Flowchart | Common Flowchart Symbols


