What Is a Picture Graph?

Picture Graph

Pictures of Graphs

Gantt chart examples

Flow Chart Symbols

Flowchart diagrams consists of symbols of process, decision, data and document, data base, termination or initiation processes, processing loops and conditions. To create an drawn flowchart use professional flowchart maker of ConceptDraw PRO.
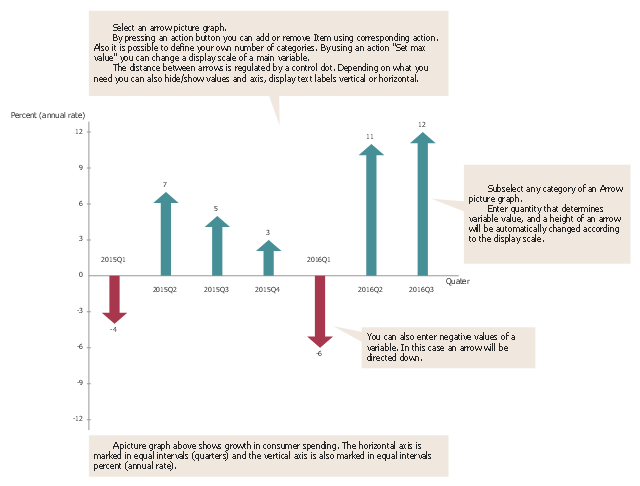
A picture chart (image chart, pictorial graph) is the type of a bar graph visualizing numarical data using symbols and pictograms.
In the field of economics and finance use a picture graph with columns in the form of coins. For population comparison statistics use a chart with columns in the form of manikins. To show data increase or decrease use arrows bar charts.
The picture graph template for the ConceptDraw PRO diagramming and vector drawing software is included in the Picture Graphs solution from the Graphs and Charts area of ConceptDraw Solution Park.
Arrows bar chart template
Basic Diagramming


HelpDesk
How to Create a Picture Graph

Rainfall Bar Chart

This sample was created in ConceptDraw PRO diagramming and vector drawing software using the Bar Graphs Solution from the Graphs and Charts area of ConceptDraw Solution Park.
Chart Maker for Presentations

- Picture Chart
- A Picture Of A Block Graph
- Picture Graphs | What Is a Picture Graph ? | Pictures of Graphs ...
- Picture Graph | Pictures of Graphs | Sales Growth. Bar Graphs ...
- Line Chart Examples | Line Graph | Pictures of Graphs | Examples Of ...
- Picture graph - Template | Picture Graph | Chart Maker for ...
- Design elements - Picture graphs | Picture graph - Template | Picture ...
- Chart Examples | Bar Graph | Pie Graph Worksheets | Images Of Bar ...
- Picture Graphs | Draw A Pie Chart To Represent The Gases That ...
- Chart Maker for Presentations | Line Graph | Picture Graph | Image ...
- ERD | Entity Relationship Diagrams, ERD Software for Mac and Win
- Flowchart | Basic Flowchart Symbols and Meaning
- Flowchart | Flowchart Design - Symbols, Shapes, Stencils and Icons
- Flowchart | Flow Chart Symbols
- Electrical | Electrical Drawing - Wiring and Circuits Schematics
- Flowchart | Common Flowchart Symbols
- Flowchart | Common Flowchart Symbols