Process Flow Diagram Symbols

This process flow diagram (PFD) of a typical crude oil distillation unit as used in petroleum crude oil refineries was redrawn from Wikipedia file: Crude Oil Distillation Unit.png. [en.wikipedia.org/ wiki/ File:Crude_ Oil_ Distillation_ Unit.png]
This file is licensed under the Creative Commons Attribution-Share Alike 3.0 Unported license. [creativecommons.org/ licenses/ by-sa/ 3.0/ deed.en]
"An oil refinery or petroleum refinery is an industrial process plant where crude oil is processed and refined into more useful products such as petroleum naphtha, gasoline, diesel fuel, asphalt base, heating oil, kerosene and liquefied petroleum gas. Oil refineries are typically large, sprawling industrial complexes with extensive piping running throughout, carrying streams of fluids between large chemical processing units. In many ways, oil refineries use much of the technology of, and can be thought of, as types of chemical plants. The crude oil feedstock has typically been processed by an oil production plant. There is usually an oil depot (tank farm) at or near an oil refinery for the storage of incoming crude oil feedstock as well as bulk liquid products.
An oil refinery is considered an essential part of the midstream side of the petroleum industry." [en.wikipedia.org/ wiki/ Oil_ refinery]
The process flow diagram (PFD) example "Crude oil distillation" was drawn using the ConceptDraw PRO diagramming and vector drawing software extended with the Chemical and Process Engineering solution from the Chemical and Process Engineering area of ConceptDraw Solution Park.
Process flow diagram (PFD)
-crude-oil-distillation-unit---pfd.png--diagram-flowchart-example.png)
Process Flow Diagram

ConceptDraw PRO diagramming and vector drawing software extended with powerful tools of Flowcharts Solution from the "Diagrams" Area of ConceptDraw Solution Park is effective for drawing: Process Flow Diagram, Flow Process Diagram, Business Process Flow Diagrams.
 Chemical and Process Engineering
This chemical engineering solution extends ConceptDraw PRO v.9.5 (or later) with process flow diagram symbols, samples, process diagrams templates and libraries of design elements for creating process and instrumentation diagrams, block flow diagrams (BFD
Process Flowchart


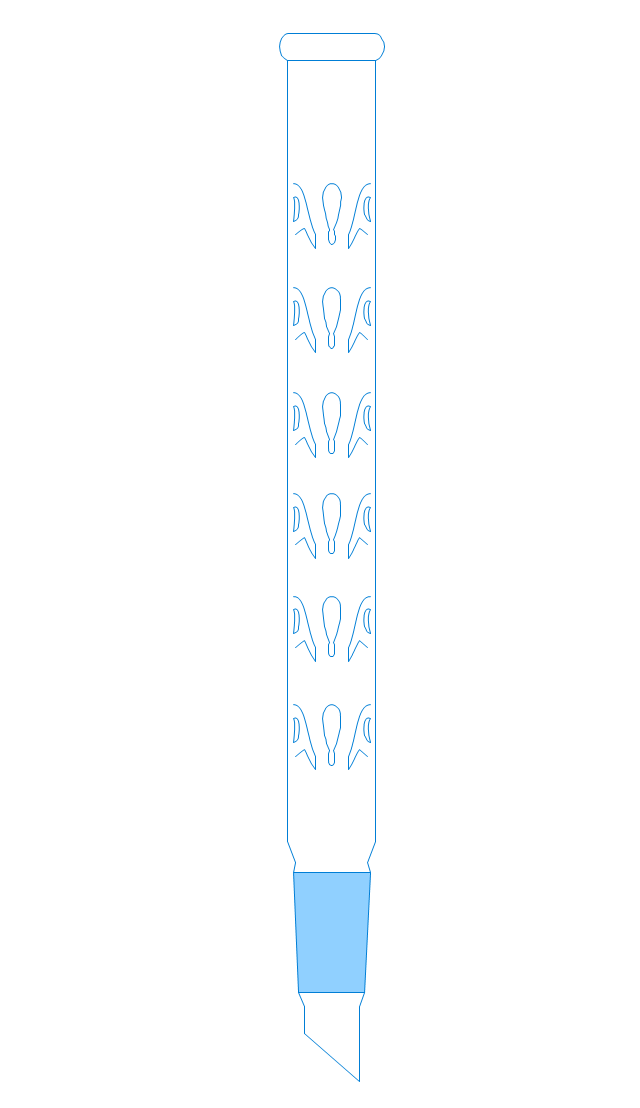
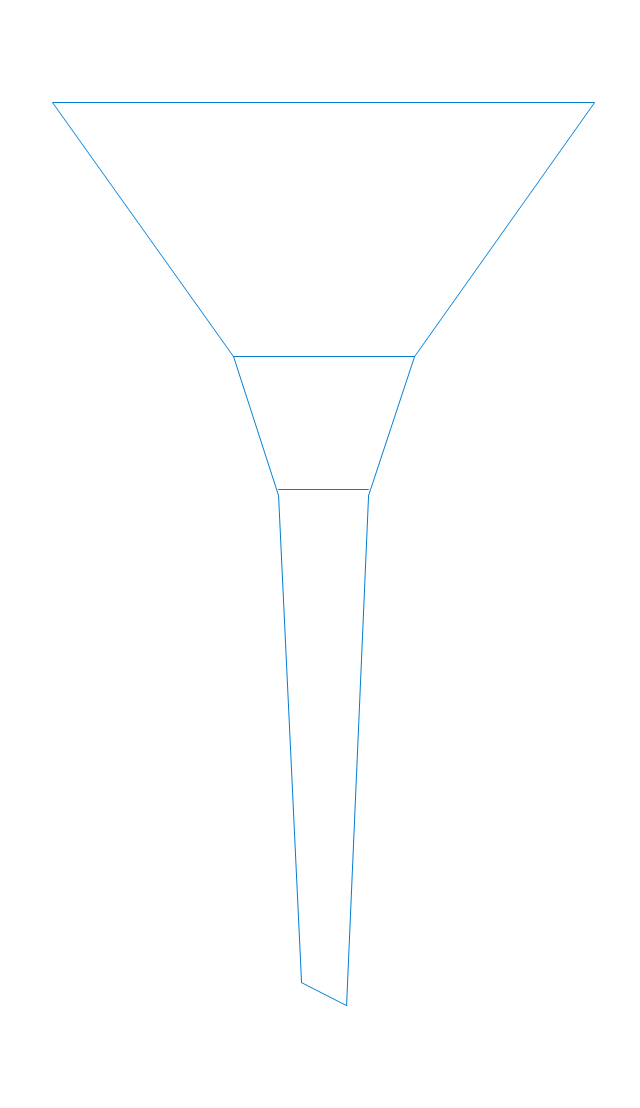
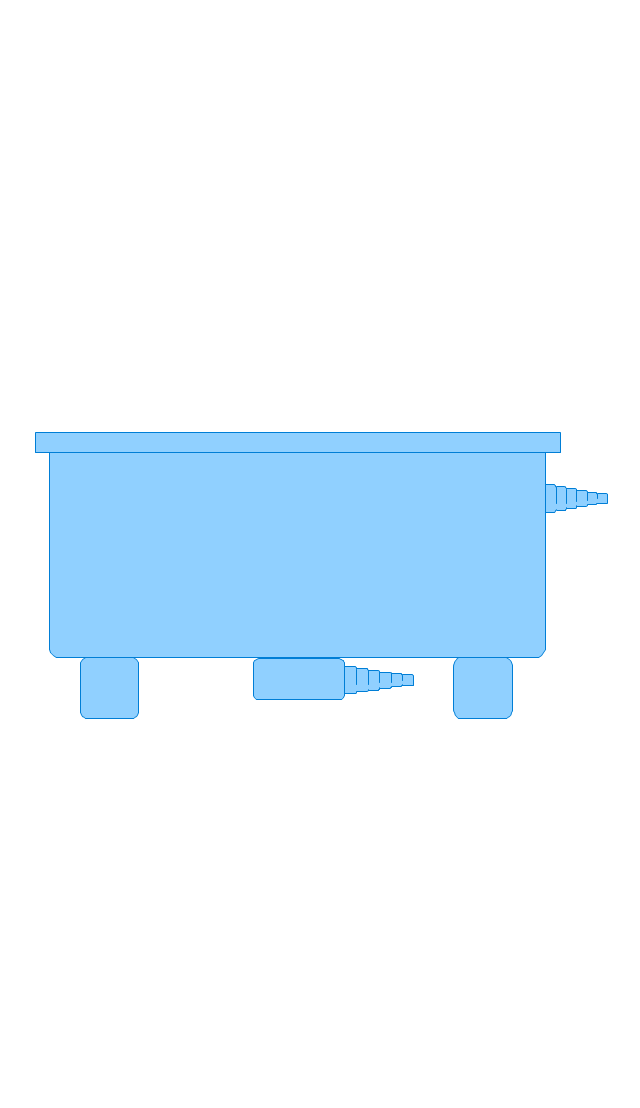
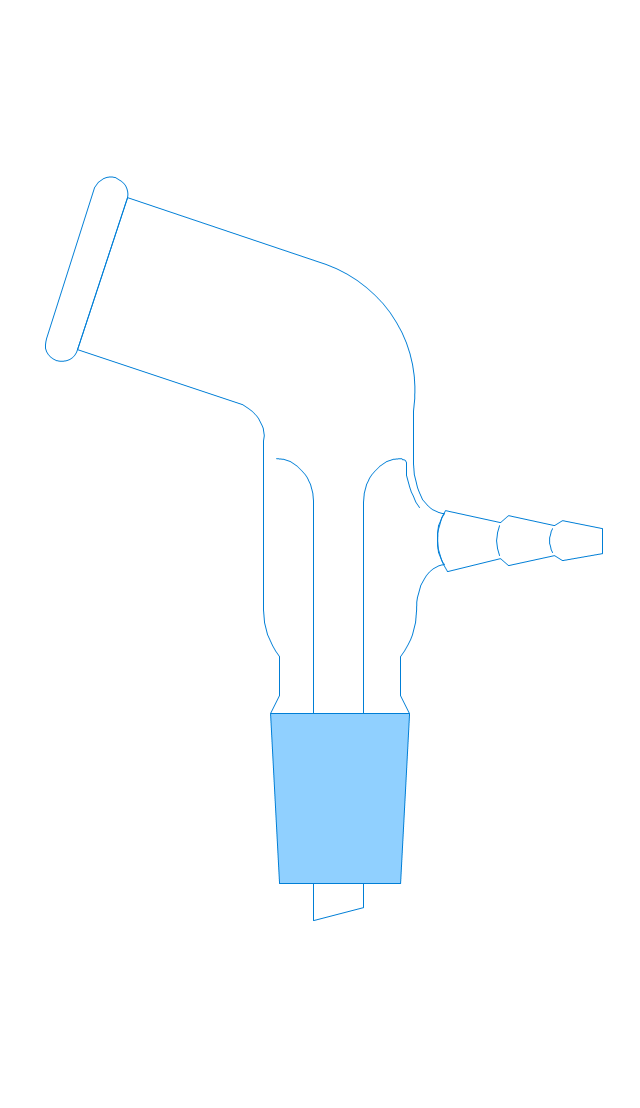
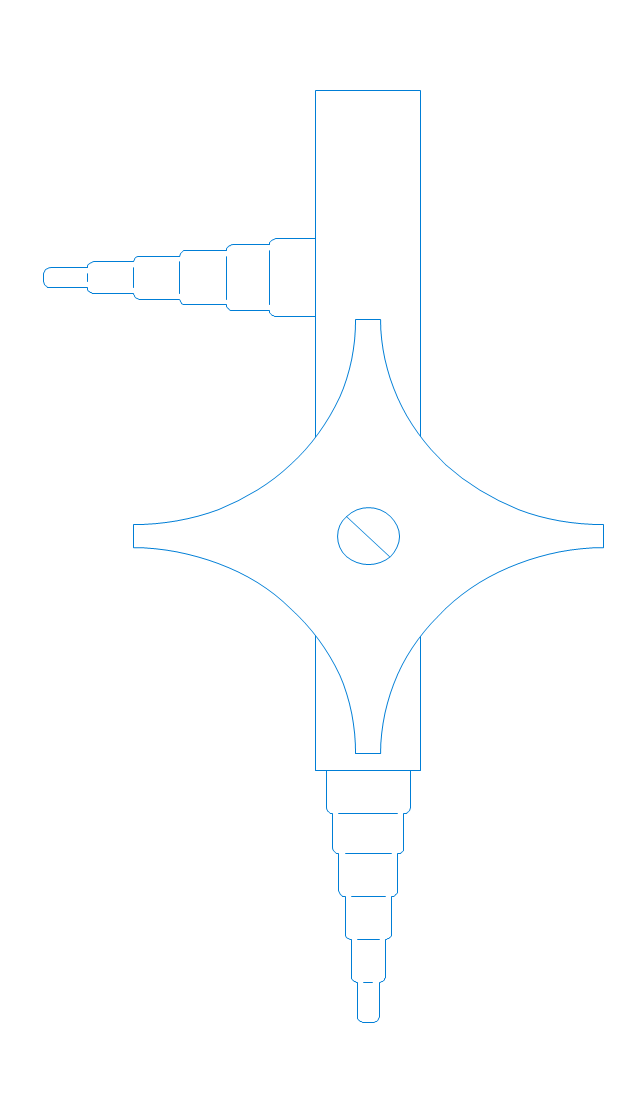
The vector stencils library "Laboratory equipment" contains 31 clipart icons of chemical laboratory equipment and labware.
Use these shapes for drawing part assembly and mounting schemes of glassware apparatus in chemical experiment diagrams and illustrations in the ConceptDraw PRO diagramming and vector drawing software extended with the Chemistry solution from the Science and Education area of ConceptDraw Solution Park.
Use these shapes for drawing part assembly and mounting schemes of glassware apparatus in chemical experiment diagrams and illustrations in the ConceptDraw PRO diagramming and vector drawing software extended with the Chemistry solution from the Science and Education area of ConceptDraw Solution Park.
Vigreux distillation column
Hirsch funnel
Oil bath

Steam bath
Thermometer

Tap (valve)
--laboratory-equipment---vector-stencils-library.png--diagram-flowchart-example.png)
Vacuum adaptor
Liebig condenser (long)
-laboratory-equipment---vector-stencils-library.png--diagram-flowchart-example.png)
Liebig condenser (short)
-laboratory-equipment---vector-stencils-library.png--diagram-flowchart-example.png)
Water faucet
Büchner flask

Stemless funnel

Stemmed funnel

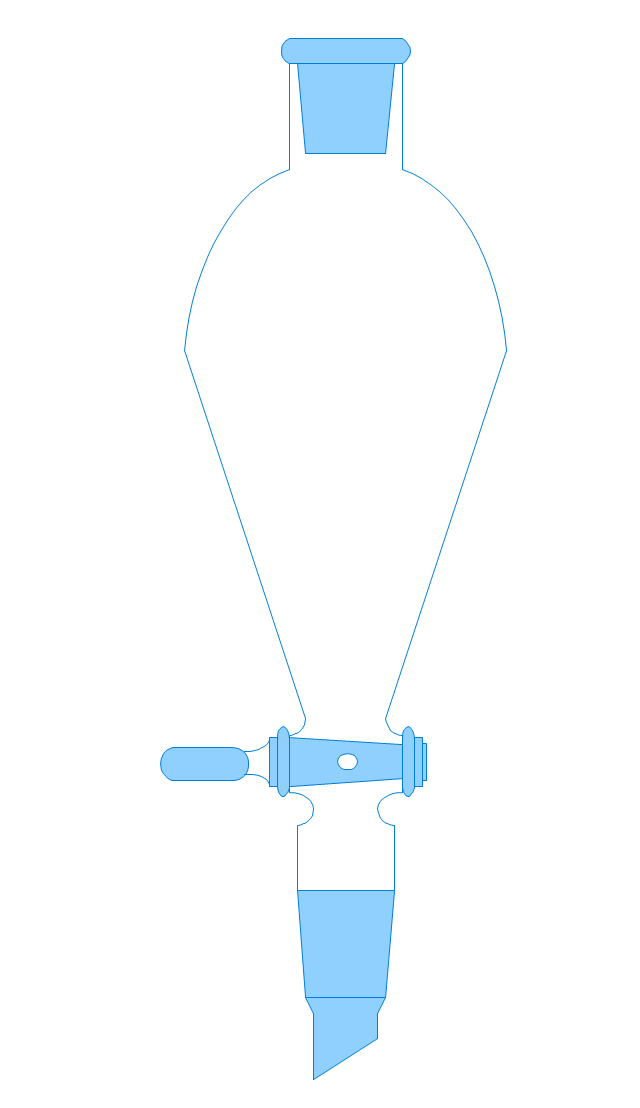
Separatory funnel
Heating mantle

Hot plate

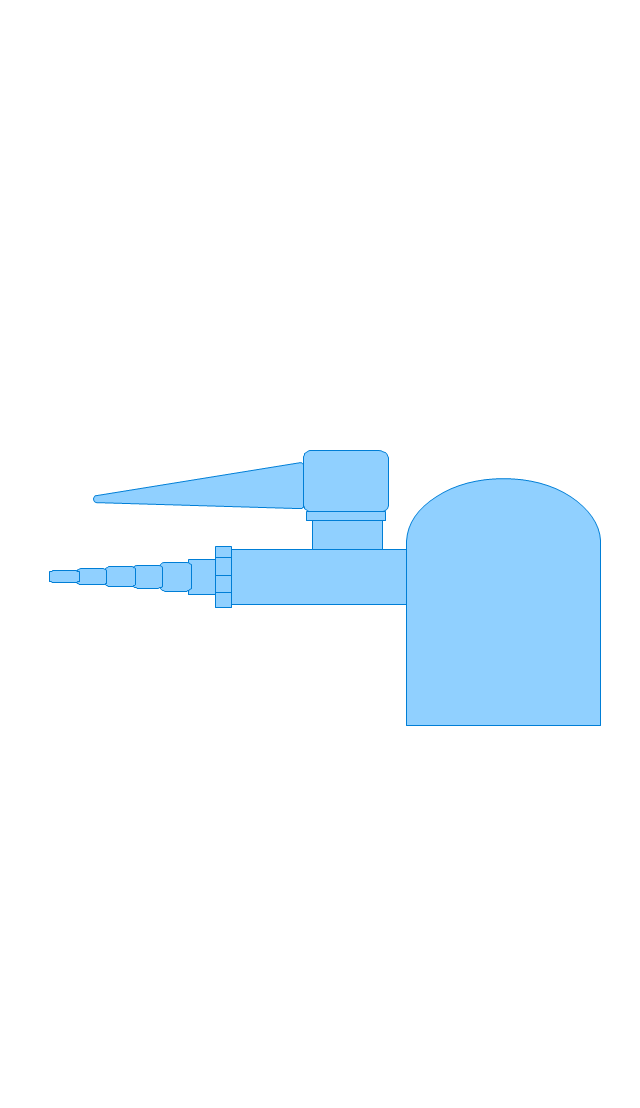
Gas tap
Folded filter paper

Y-Adaptor

Claisen adapter

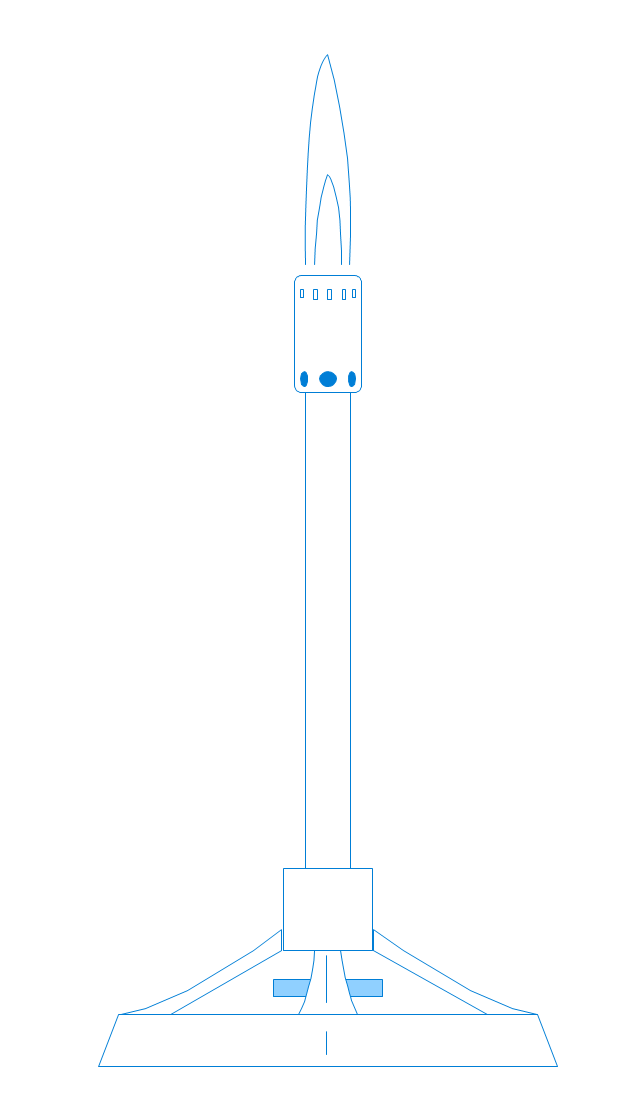
Bunsen burner
Büchner funnel

Erlenmeyer flask, 25ml

Round-bottom flask, 50ml

Round-bottom flask, 250ml

Beaker 100ml, filled

Beaker 100ml, empty

Beaker 500ml, filled
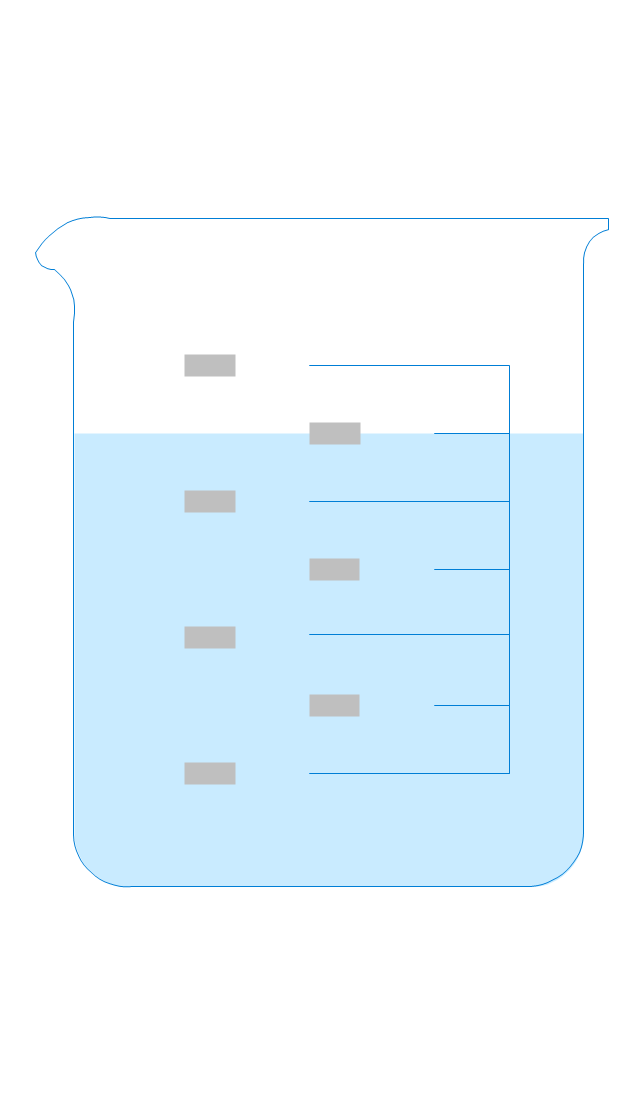
Beaker 500ml, empty

Erlenmeyer flask 250ml, filled
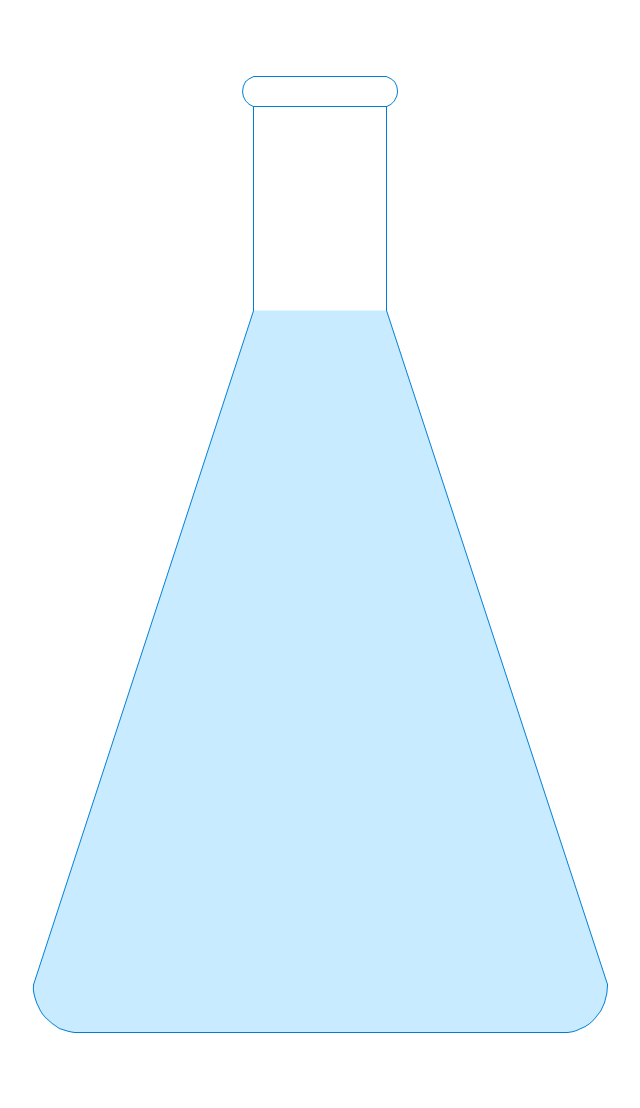
Erlenmeyer flask 250ml, empty

Technical Drawing Software

ConceptDraw PRO extended with: Mechanical Engineering Solution, Electrical Engineering Solution, Chemical and Process Engineering Solution from the Industrial Engineering Area is powerful software for business and technical drawing. Its powerful drawing tools, predesigned vector objects, templates, samples are helpful for creation all kinds of Technical Drawings and Technical Diagrams, Electrical and Mechanical Schematics, Circuit and Wiring Diagrams, Structural Drawings, and many other.
Building Drawing Design Element: Storage and Distribution


Types of Flowcharts


Process and Instrumentation Diagram

 Health Food
The Health Food solution contains the set of professionally designed samples and large collection of vector graphic libraries of healthy foods symbols of fruits, vegetables, herbs, nuts, beans, seafood, meat, dairy foods, drinks, which give powerful possi
Healthy Food Ideas

Design Pictorial Infographics. Design Infographics

- Well Label Diagram Of Crude Distillation Unit
- Distillation Diagram To Label
- Chemical and Process Engineering | Draw Distillation And Label
- Draw And Label Distillation
- Crude oil distillation unit - PFD | Labeled Diagram Of Petroleum Well
- Crude oil distillation unit - PFD | Process Flow Diagram Symbols ...
- Well Label Diagram Of A Simple Distillation Process
- A Well Label Diagram Of A Simple Distillation Process
- A Well Labelled Diagram Of Simple Distillation Process
- Sketch A Well Label Diagram Of Heat Apparatus
- Process Flow Diagram Symbols | Building Drawing Design Element ...
- Labelled Diagram Of Simple Distillation Process
- Draw Labeled Diagram Of Distillation Of Petroleum
- Diagram Of A Heating Mantle With Label
- Labelled Diagram Of Refining Of Petrolium
- Simple Distillation Flow Diagram
- Diagram Of A Simple Distilation Unit With Label
- A Well Label Diagram Of Heat Block
- Labelled Diagram Of Chemical
- Draw A Labelled Diagram Of Petroleum Industries
- ERD | Entity Relationship Diagrams, ERD Software for Mac and Win
- Flowchart | Basic Flowchart Symbols and Meaning
- Flowchart | Flowchart Design - Symbols, Shapes, Stencils and Icons
- Flowchart | Flow Chart Symbols
- Electrical | Electrical Drawing - Wiring and Circuits Schematics
- Flowchart | Common Flowchart Symbols
- Flowchart | Common Flowchart Symbols