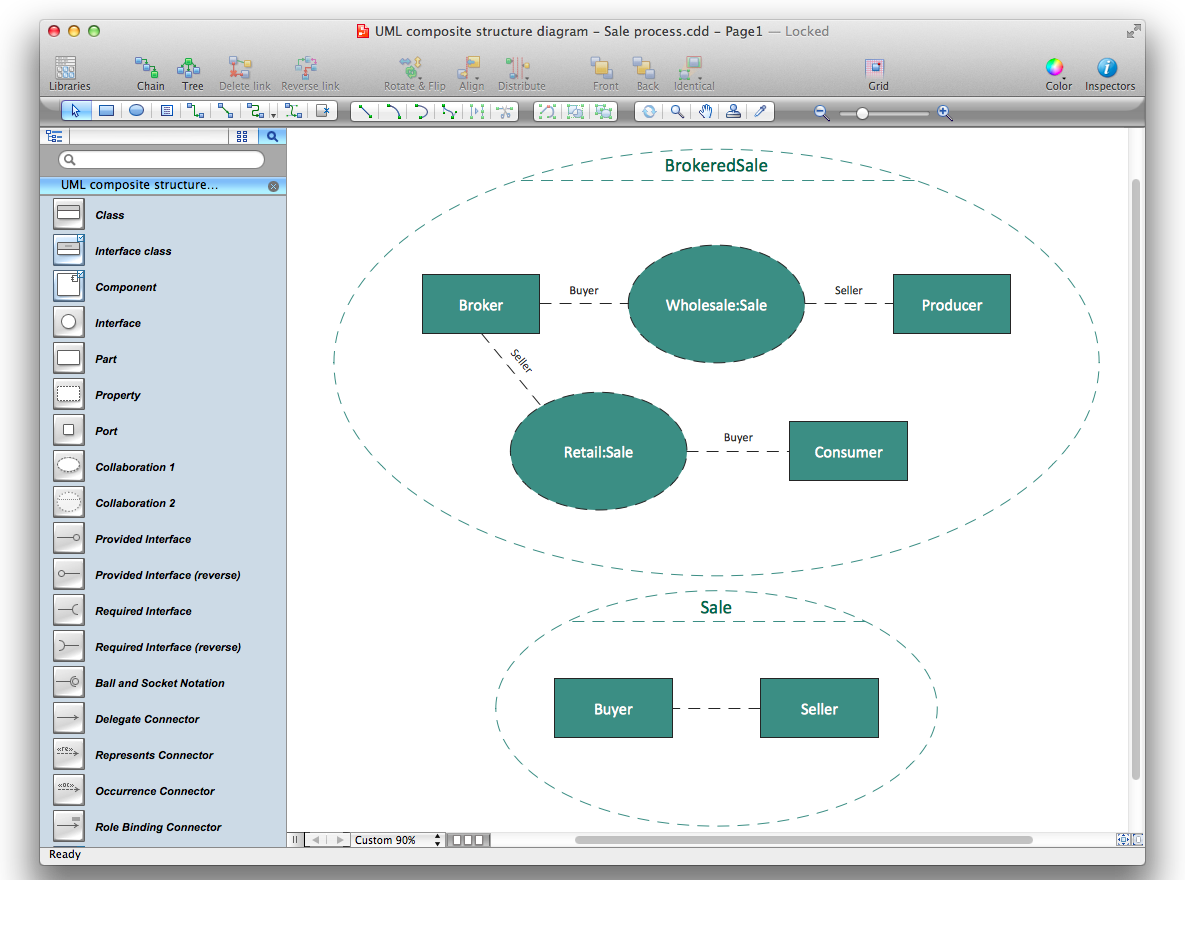
Diagramming Software for UML Composite Structure Diagrams

Entity Relationship Diagram Symbols

ERD symbols used for professional ERD drawing are collected in libraries from the Entity-Relationship Diagram (ERD) solution for ConceptDraw DIAGRAM.
UML Class Diagram Notation

ConceptDraw DIAGRAM ER Diagram Tool

ConceptDraw ER Diagram Tool works across any platform, meaning you never have to worry about compatibility again. ConceptDraw DIAGRAM allows you to make Entity-Relationship Diagram (ERD) on PC or macOS operating systems.
Data Flow Diagrams

UML Use Case Diagram Example - Estate Agency
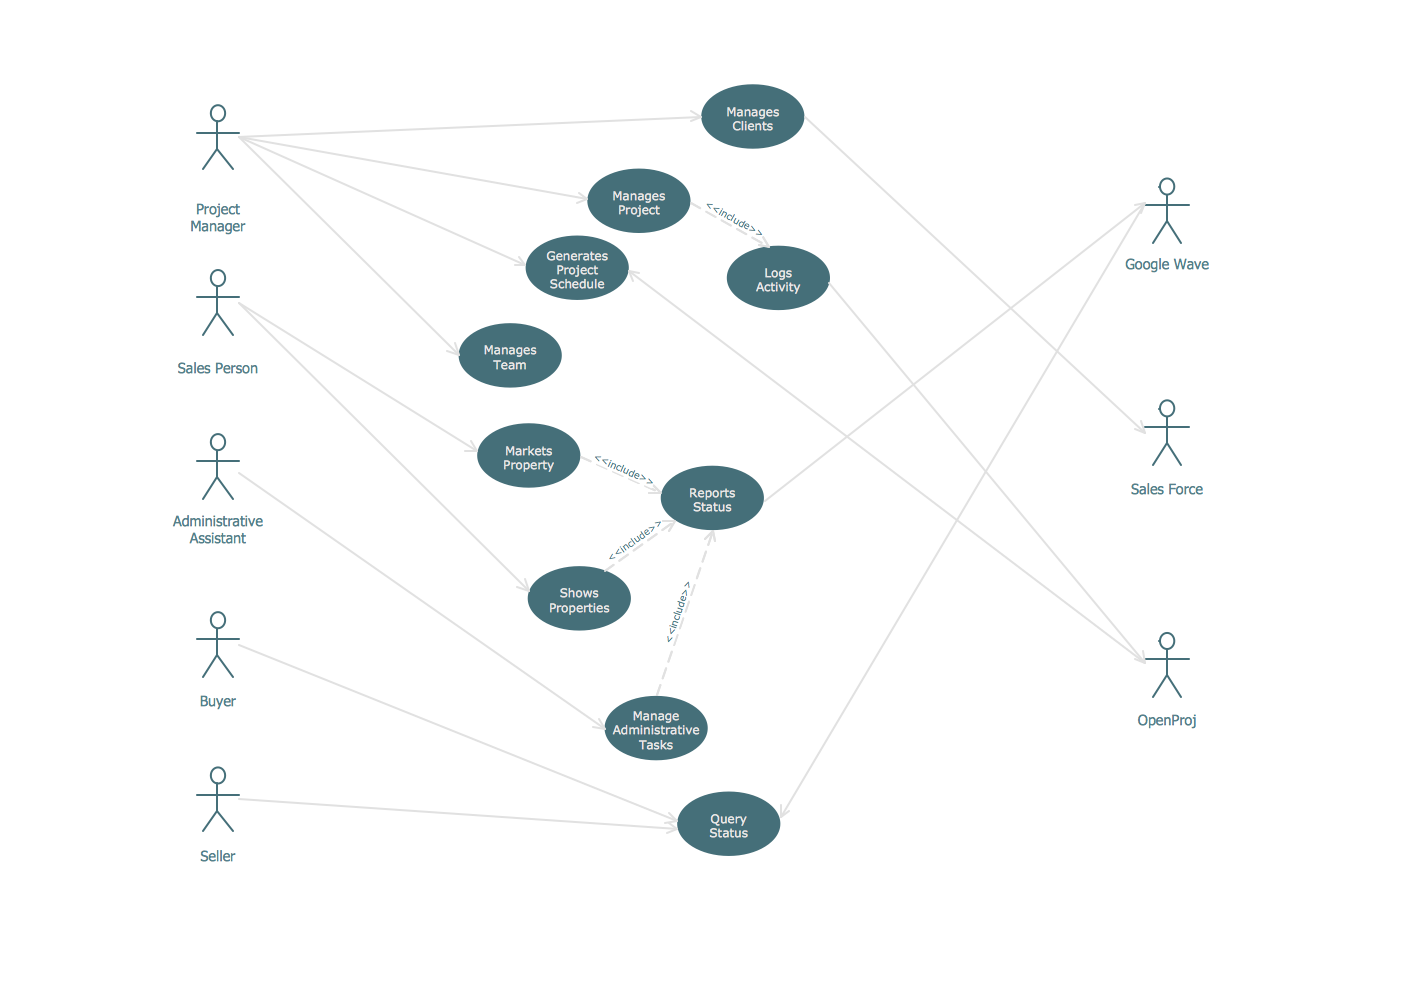
This sample shows the work of the estate agency and is used by the estate agencies, building companies, at the trainings of the estate agencies, for understanding the working processes of the estate agencies.
UML Deployment Diagram
Use ConceptDraw DIAGRAM with UML deployment diagram templates, samples and stencil library from Rapid UML solution to model the physical deployment of artifacts on nodes of your software system.
Martin ERD Diagram

ERD Symbols and Meanings

The Chen's ERD notation is still used and is considered to present a more detailed way of representing entities and relationships.
To create an ERD, software engineers mainly turn to dedicated drawing software, which contain the full notation resources for their specific database design - ERD symbols and meanings. CS Odessa has released an all-inclusive Entity-Relationship Diagram (ERD) solution for their powerful drawing program, ConceptDraw DIAGRAM.

"Crow's Foot notation is used in Barker's Notation, SSADM and Information Engineering. Crow's Foot diagrams represent entities as boxes, and relationships as lines between the boxes. Different shapes at the ends of these lines represent the cardinality of the relationship." [Entity–relationship model. Wikipedia]
The vector stencils library ERD, crow's foot notation contains 18 symbols for creating the ER-diagrams using the ConceptDraw PRO diagramming nd vector drawing software.
The example"Design elements - ERD solution (crow's foot notation)" is included in the Entity-Relationship Diagram (ERD) solution from the Software Development area of ConceptDraw Solution Park.
Crow's foot ERD
.png--diagram-flowchart-example.png)
- Crow's Foot Notation | Uml Cardinality Notation
- Uml Notation For Cardinality Of Erd Relationships
- What Is The Uml Notation For A Cardinality Of Erd Relationships
- UML Class Diagram Notation | Design elements - ERD (crow's foot ...
- In Chen Notation There Is No Way To Represent Cardinality
- Cardinality Of Class
- Design elements - ER diagram (Chen notation) | Cardinality ...
- Design elements - ERD (crow's foot notation) | Erd Cardinalities
- Cardinality Notation
- Example Of Crow Foot With The Cardinality
- ERD | Entity Relationship Diagrams, ERD Software for Mac and Win
- Flowchart | Basic Flowchart Symbols and Meaning
- Flowchart | Flowchart Design - Symbols, Shapes, Stencils and Icons
- Flowchart | Flow Chart Symbols
- Electrical | Electrical Drawing - Wiring and Circuits Schematics
- Flowchart | Common Flowchart Symbols
- Flowchart | Common Flowchart Symbols