HelpDesk
How to Draw an Organizational Chart Using ConceptDraw PRO
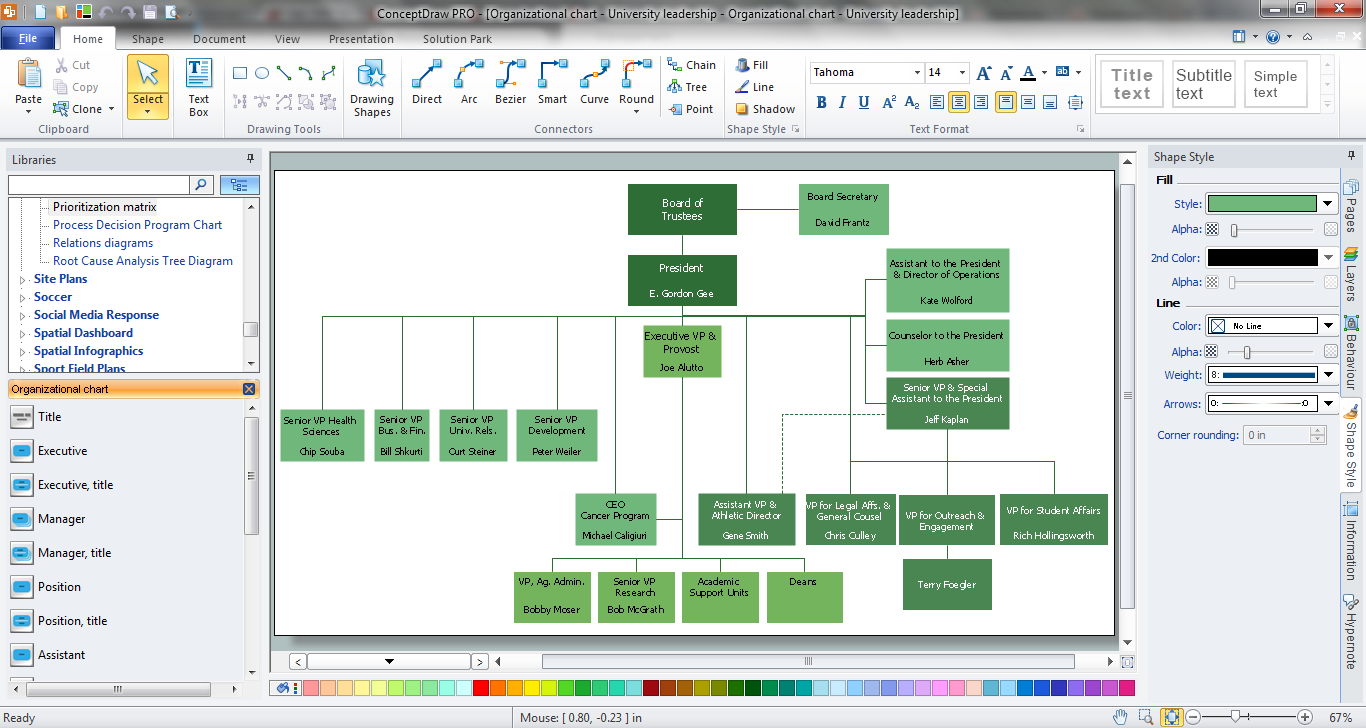
The organizational chart software is a valuable tool for modern business. It is important for any business to build a clear organizational structure that determines the responsibilities and relationships between different positions in the organization. The clear structured organization - means the clear structured business workflow, which is the core of success in the business. ConceptDraw PRO is an org chart software that allows you to draw an organizational structure of your company quickly and easily.
 Organizational Charts
Organizational Charts solution extends ConceptDraw PRO software with samples, templates and library of vector stencils for drawing the org charts.
Marketing Organization Chart
You need design the Marketing Organization Chart and look for effective software? Now it's incredibly easy to do this in ConceptDraw PRO which was supplied with Marketing Diagrams Solution from the Marketing Area of ConceptDraw Solution Park.Organizational Chart
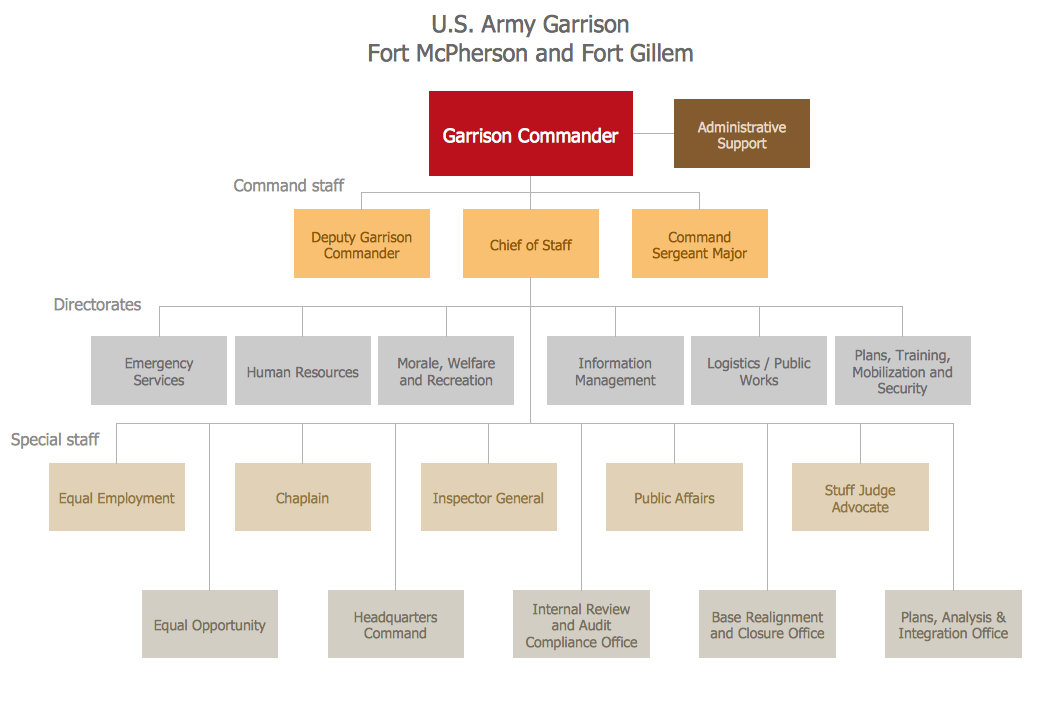
An organizational chart is a diagram that shows the structure of an organization and the relationships of its parts. ConceptDraw PRO extended with Organizational Charts Solution from the Management Area is powerful Organizational Chart Software.Functional Organizational Structure
A functional organizational structure is a structure that consists of activities such as coordination, supervision and task allocation. You want to draw a functional organizational structure and look for the helpful software for this? Pay attention for the ConceptDraw PRO software! Extended with Organizational Charts Solution from the Management Area, it is ideal for functional organizational structure development.Organizational Structure Diagram Software
ConceptDraw PRO extended with Organizational Charts Solution from the Management Area is a powerful but easy-to-use Organizational Structure Diagram Software.Organizational Charts Solution provides a wide variety of templates and samples and large quantity of predesigned vector objects to help you design your Organizational Structure Diagrams and other business diagrams.

Organization Chart
ConceptDraw PRO diagramming and vector drawing software extended with 25 Typical Orgcharts solution from the Management area of ConceptDraw Solution Park offers 25 ready Organization Chart templates, 10 samples and 2 libraries with predesigned vector objects.Business Diagram Software
ConceptDraw business diagram Software is the most powerful business and relational charting software. Create advanced, completely customizable flow charts, organizational charts, business process diagrams, work flow diagrams, audit diagram, value stream maps, TQM diagrams, ERD diagrams, EPC diagrams, marketing diagrams, cause and effect diagrams, dashboards, infographics and other relational business diagrams from your data.
Basic Flowchart Symbols and Meaning
Flowchart Symbols and Meaning - Provides a visual representation of basic flowchart symbols and their proposed use in professional workflow diagram, standard process flow diagram and communicating the structure of a well-developed web site, as well as their correlation in developing on-line instructional projects. See flowchart's symbols by specifics of process flow diagram symbols and workflow diagram symbols.
ConceptDraw PRO Compatibility with MS Visio
For those who are migrating from MS Visio to ConceptDraw PRO, or for those who have colleagues and clients who use Visio, ConceptDraw PRO is compatible with MS Visio .VSDX formatted files..VSDX is Visio’s open XML file format, and it can be easily imported and exported by ConceptDraw PRO.Swim Lane Diagrams
Swim Lane diagrams are the variety of process flow diagrams and are based on the IDEF3 standard. They were developed by Lynn Shostack for usage in projecting. With their help organization diagrams are combined with process flow, as they visually display an object of the production system which is charged with given concrete processes in general flow of processes of the production system.Cause and Effect Fishbone Diagram
Cause and Effect Fishbone Diagram is one of the popular productivity and management tools widely used in business organizations. It is also known as Fishbone Diagram, because it looks like a fish skeleton. Cause and Effect Diagram provides a structured way which helps to identify all possible causes of a problem. Cause and Effect Diagram can be applied anywhere where exists a causal relationship.Now the problem of complexity the Cause and Effect Fishbone Diagram creating is solved thanks to the ConceptDraw PRO diagramming and vector drawing software extended with Fishbone Diagrams solution from the Management area.
Basic Diagramming
Perfect charts and graphics diagramming software with rich examples and template. ConceptDraw is ideal to draw Charts and Graphics.
Is ConceptDraw PRO an Alternative to Microsoft Visio?
Visio for Mac and Windows - ConceptDraw as an alternative to MS Visio. ConceptDraw PRO delivers full-functioned alternative to MS Visio. ConceptDraw PRO supports import of Visio files. ConceptDraw PRO supports flowcharting, swimlane, orgchart, project chart, mind map, decision tree, cause and effect, charts and graphs, and many other diagram types.MS Visio Look a Like Diagrams
No need for any special drawing skills to create professional looking diagrams outside of your knowledge base. ConceptDraw PRO takes care of the technical details, allowing you to focus on your job, not the drawing.ConceptDraw PRO delivers full-functioned alternative to MS Visio. ConceptDraw PRO supports import of Visio files. ConceptDraw PRO supports flowcharting, swimlane, orgchart, project chart, mind map, decision tree, cause and effect, charts and graphs, and many other diagram types.
- How Does An Organizational Chart Look Like
- How Does An Organogram Look Like To Illustrate The Different
- Orgchart | Organizational Chart Template | MS Visio Look a Like ...
- Organizational Chart Template | Bar Chart Template for Word | Pie ...
- How to Draw an Organization Chart | Examples of Flowcharts, Org ...
- Organizational Chart Template | Chart Templates | Pie Chart Word ...
- Donut Chart Templates | Chart Templates | Organization Chart ...
- Orgchart | Organizational Chart Template | Organization Chart | Org ...
- Business diagrams & Org Charts with ConceptDraw PRO
- Marketing and Sales Organization chart . Organization chart Example
- Organizational Chart Template | Flowchart Software | Seating Chart ...
- Organizational Chart Templates
- Examples of Flowcharts, Org Charts and More | Business Report Pie ...
- Organizational Chart Template | Seating Chart Template Free ...
- Seating Chart Template Free | Organizational Chart Template ...
- Examples of Flowcharts, Org Charts and More | Marketing and Sales ...
- How to Draw an Organization Chart | Orgchart | Create ...
- Organizational Chart Template | Flowchart Software | Context ...
- Organizational Chart Template
- Free Organizational Chart Templates
- ERD | Entity Relationship Diagrams, ERD Software for Mac and Win
- Flowchart | Basic Flowchart Symbols and Meaning
- Flowchart | Flowchart Design - Symbols, Shapes, Stencils and Icons
- Flowchart | Flow Chart Symbols
- Electrical | Electrical Drawing - Wiring and Circuits Schematics
- Flowchart | Common Flowchart Symbols
- Flowchart | Common Flowchart Symbols


