Project —Task Trees and Dependencies

Project — Working With Tasks

These videos provide a series of lessons that will enhance the understanding of all our users, from people just starting out with the software, through to expert users.
How To Make a Bubble Chart

Flow Chart Symbols

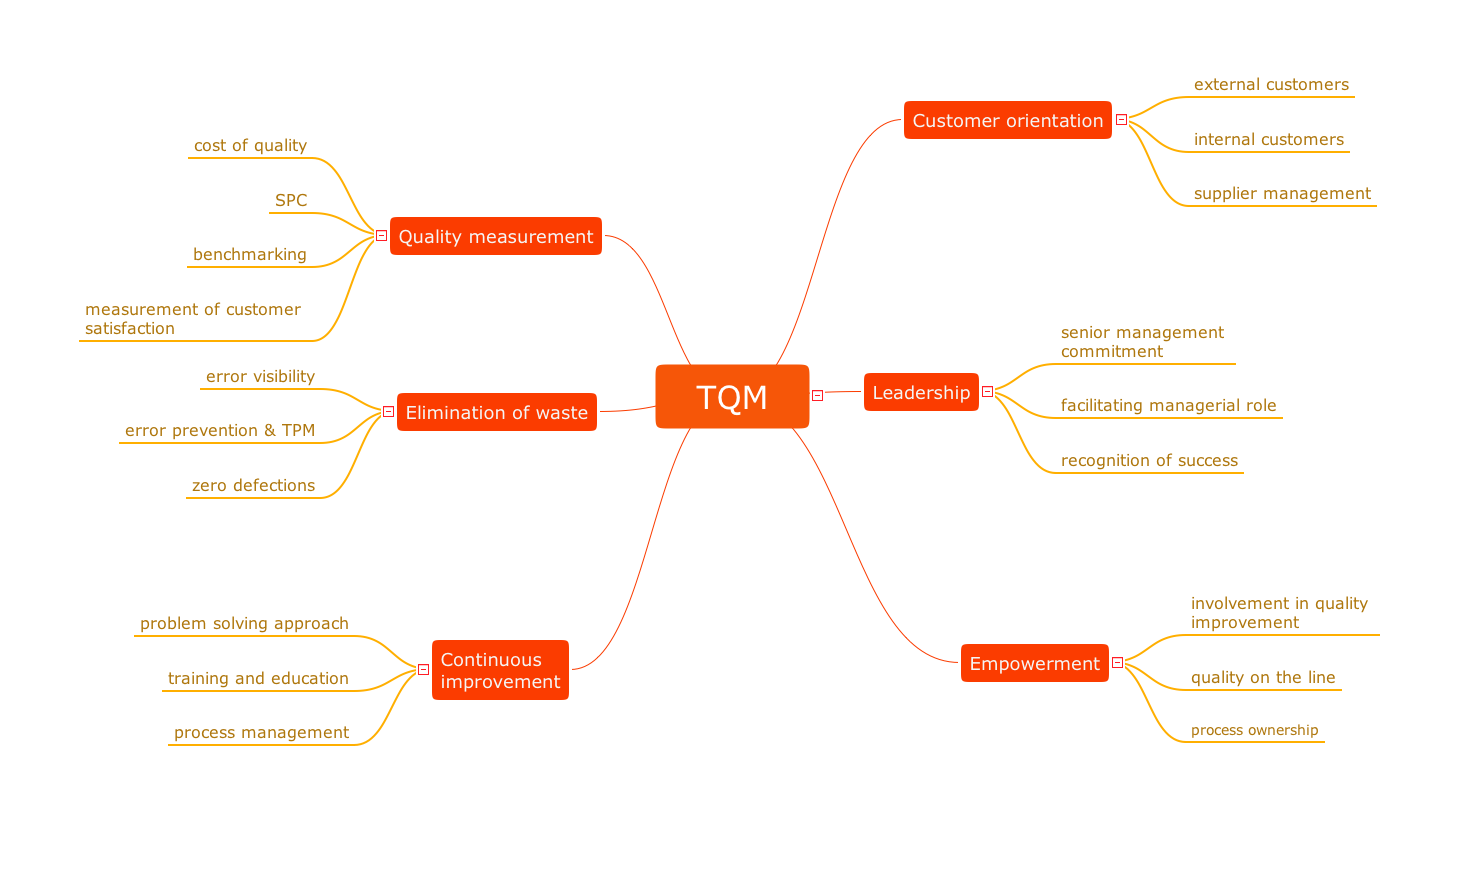
Quality issues in heir organization
Flow Chart Online

 Logistics Flow Charts
Logistics Flow Charts solution extends ConceptDraw DIAGRAM functionality with opportunities of powerful logistics management software. It provides large collection of predesigned vector logistic symbols, pictograms, objects and clipart to help you design with pleasure Logistics flow chart, Logistics process flow diagram, Inventory flow chart, Warehouse flowchart, Warehouse management flow chart, Inventory control flowchart, or any other Logistics diagram. Use this solution for logistics planning, to reflect logistics activities and processes of an enterprise or firm, to depict the company's supply chains, to demonstrate the ways of enhancing the economic stability on the market, to realize logistics reforms and effective products' promotion.
Business Diagram Software


Cross Functional Flowchart Examples

Try now Flowchart Software and Cross-Functional library with 2 libraries and 45 vector shapes of the Cross-Functional Flowcharts solution. Then you can use built-in templates to create and present your software service cross-function process flowcharts.
 ConceptDraw Solution Park
ConceptDraw Solution Park collects graphic extensions, examples and learning materials
Value-Stream Mapping for Manufacturing

Cross-Functional Flowchart (Swim Lanes)

Use flowchart maker of ConceptDraw DIAGRAM enhanced with solutions from ConceptDraw Solution Park to create diagrams to present and explain structures, process flows, logical relationships, networks, design schemes and other visually organized information and knowledge.
 Fault Tree Analysis Diagrams
This solution extends ConceptDraw DIAGRAM.5 or later with templates, fault tree analysis example, samples and a library of vector design elements for drawing FTA diagrams (or negative analytical trees), cause and effect diagrams and fault tree diagrams.
ConceptDraw Arrows10 Technology

- points;
- Connecting groups of objects;
- Auto-routing;
- Connectors text;
- Snap to Guides ;
- Quick.
Workflow Diagram

The workflow represents the transferring of data, documents or tasks during a work process. To make it easier to study and analyze working processes, and to present them in a simple visual manner, workflow diagrams are used. To create these diagrams professional use workflow diagram maker software ConceptDraw DIAGRAM.
- Example Of Tree Or Stream Chart
- What And When To Use Tree Or Stream Chart
- Tree Or Stream Chart Example
- What Is Tree Or Stream Chart
- Tree Or Stream Chart
- Types of Flowcharts | Tree And Streem Chart
- Sample Of Tree Or Stream Chart For Weather
- Tree Or Stream Chart Definition
- What Is The Use Of Tree Or Stream Chart
- Tree Chart Or Stream Chart
- Types Of Tree Chart
- Planning Tree Chart
- Fault Tree Diagram | Pyramid Diagram and Pyramid Chart | How to ...
- Types of Flowcharts | Flow Chart Symbols | How to Make an ...
- Good Flow Chart app for Mac | How to Draw an Organization Chart ...
- Root Cause Tree Diagram | Process Flowchart | ConceptDraw ...
- Fault Tree Diagram | Types of Flowcharts | Marketing Diagrams ...
- Process Flowchart | UML Use Case Diagram Example Social ...
- Types of Flowchart - Overview | Flowchart Example: Flow Chart of ...
- Value Stream Mapping | Fault Tree Analysis Diagrams | Fault Tree ...
- ERD | Entity Relationship Diagrams, ERD Software for Mac and Win
- Flowchart | Basic Flowchart Symbols and Meaning
- Flowchart | Flowchart Design - Symbols, Shapes, Stencils and Icons
- Flowchart | Flow Chart Symbols
- Electrical | Electrical Drawing - Wiring and Circuits Schematics
- Flowchart | Common Flowchart Symbols
- Flowchart | Common Flowchart Symbols