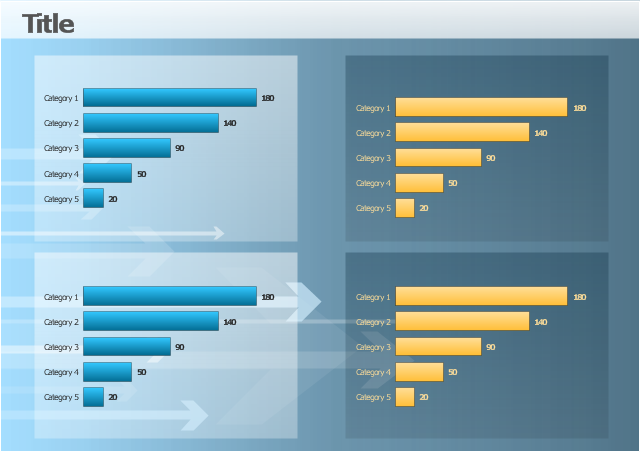
The template "Comparison dashboard" for the ConceptDraw PRO diagramming and vector drawing software is included in the Comparison Dashboard solution from the area "What is a Dashboard" of ConceptDraw Solution Park.
Visual dashboard template
Sales Dashboard Examples
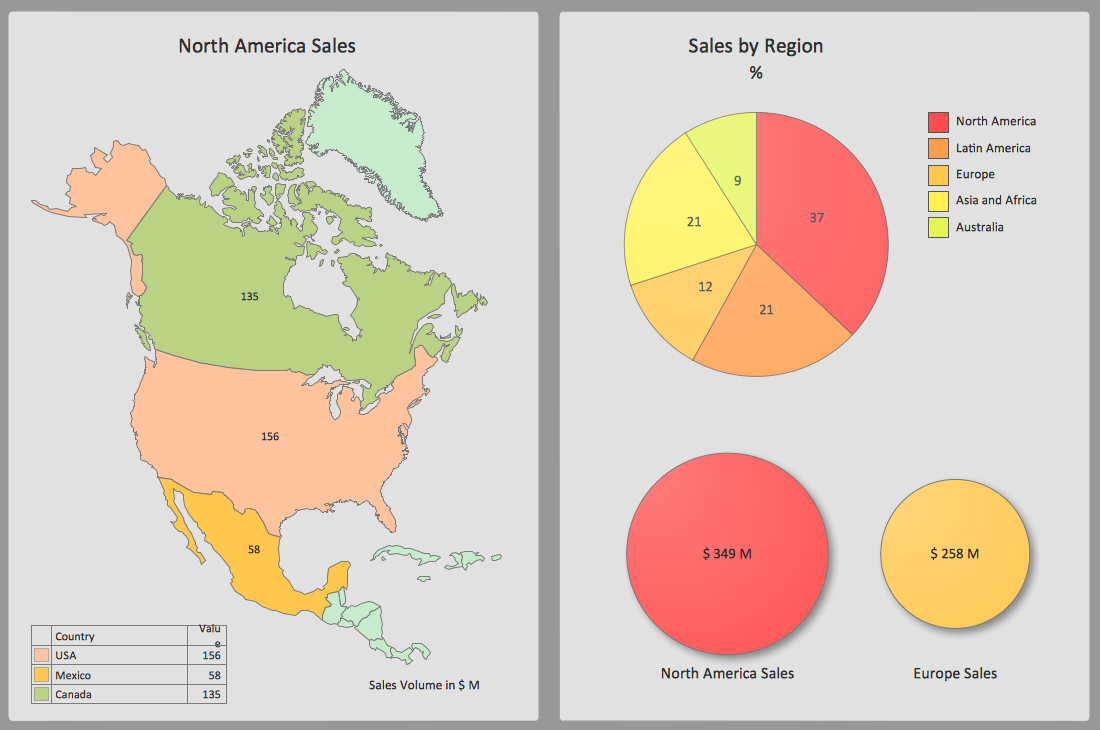
"Dashboards can be broken down according to role and are either strategic, analytical, operational, or informational. Strategic dashboards support managers at any level in an organization, and provide the quick overview that decision makers need to monitor the health and opportunities of the business. Dashboards of this type focus on high level measures of performance, and forecasts. Strategic dashboards benefit from static snapshots of data (daily, weekly, monthly, and quarterly) that are not constantly changing from one moment to the next. Dashboards for analytical purposes often include more context, comparisons, and history, along with subtler performance evaluators. Analytical dashboards typically support interactions with the data, such as drilling down into the underlying details. Dashboards for monitoring operations are often designed differently from those that support strategic decision making or data analysis and often require monitoring of activities and events that are constantly changing and might require attention and response at a moment's notice." [Dashboard (business). Wikipedia]
The business performance digital dashboard template "Time series dashboard" for the ConceptDraw PRO diagramming and vector drawing software is included in the Time Series Dashboard solution from the area "What is a Dashboard" of ConceptDraw Solution Park.
The business performance digital dashboard template "Time series dashboard" for the ConceptDraw PRO diagramming and vector drawing software is included in the Time Series Dashboard solution from the area "What is a Dashboard" of ConceptDraw Solution Park.
Time series dashboard - Template
 Logistic Dashboard
The powerful tools of Logistic Dashboard solution and specially developed live graphic objects of logistic icons, logistic navigation elements, logistic indicators, logistic charts and logistic maps effectively assist in designing Logistic dashboards, Logistic maps, Logistic charts, diagrams and infographics. The included set of prebuilt samples and quick-start templates, demonstrates the power of ConceptDraw DIAGRAM software in logistics management, its assisting abilities in development, realization and analyzing the logistic processes, as well as in perfection the methods of logistics management.
This multipage performance dashboard template contains navigation tab set and graphic indicators of logistic key performance indicators (KPIs) and business metrics.
Use it to create your logistic performance dashboard with ConceptDraw PRO software.
The business dashboard template "Logistics Performance Dashboard" is included in Logistic Dashboard solution from Business Processes area of ConceptDraw Solution Park.
Use it to create your logistic performance dashboard with ConceptDraw PRO software.
The business dashboard template "Logistics Performance Dashboard" is included in Logistic Dashboard solution from Business Processes area of ConceptDraw Solution Park.
Transportation KPIs
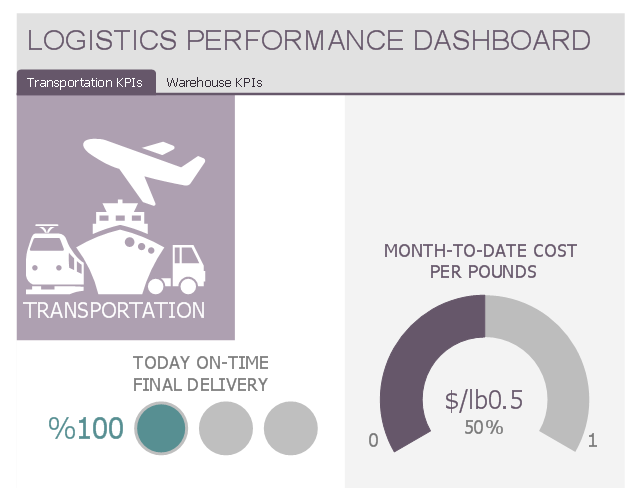
Warehouse KPIs

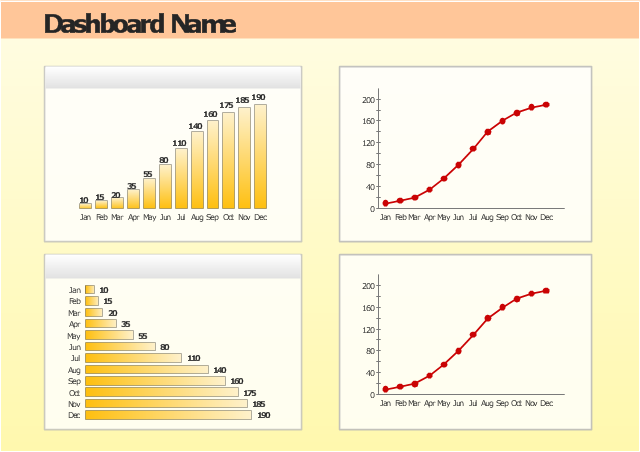
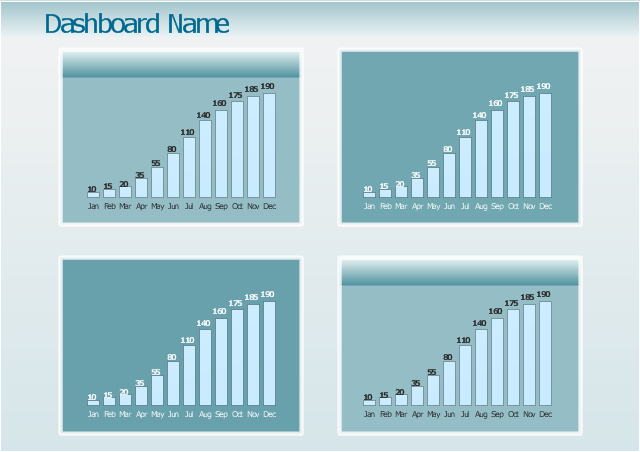
This dashboard template consist of 4 column charts. All these column charts are Live Objects displaying the data from the external source files. Use it to create your business performance management dashboard showing 4 time series of your metrics.
The business performance dashboard template "Time series digital dashboard" for the ConceptDraw PRO diagramming and vector drawing software is included in the Time Series Dashboard solution from the area "What is a Dashboard" of ConceptDraw Solution Park.
The business performance dashboard template "Time series digital dashboard" for the ConceptDraw PRO diagramming and vector drawing software is included in the Time Series Dashboard solution from the area "What is a Dashboard" of ConceptDraw Solution Park.
Time series digital dashboard - Template
This visual dashboard template contains two histograms and two area charts.
Use it to display your frequency distribution data. Each of them is Live Object and shows data from data source files. To select data source file for the chart use Action menu.
The template "Frequency distribution dashboard" for the ConceptDraw PRO diagramming and vector drawing software is included in the Frequency Distribution Dashboard solution from the area "What is a Dashboard" of ConceptDraw Solution Park.
Visual dashboard template

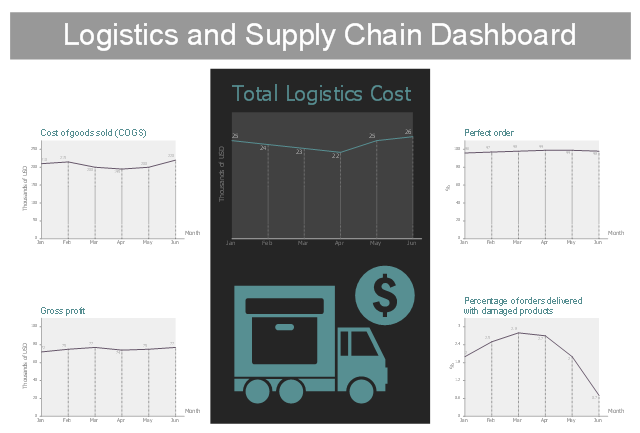
This business dashboard template contains 5 line charts of logistics and supply chain business metrics.
Use it to create your logistic and supply chain dashboard with ConceptDraw PRO software.
The performance dashboard template "Logistics and Supply Chain Dashboard" is included in Logistic Dashboard solution from Business Processes area of ConceptDraw Solution Park.
Use it to create your logistic and supply chain dashboard with ConceptDraw PRO software.
The performance dashboard template "Logistics and Supply Chain Dashboard" is included in Logistic Dashboard solution from Business Processes area of ConceptDraw Solution Park.
Logistic dashboard
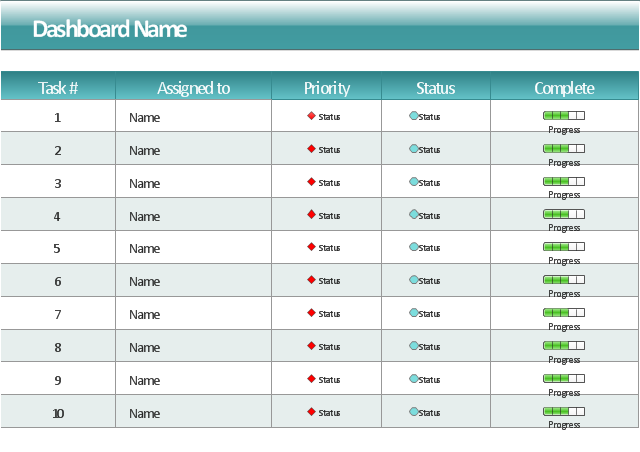
This project task status dashboard template display the task table consisting of the columns for task number, assignment (responsible person name), priority, status and complete. The task priority and status are indicated with alert visual indicators. The task complete is showed by progress indicators.
The template "Project task status dashboard" for the ConceptDraw PRO diagramming and vector drawing software is included in the Status Dashboard solution from the area "What is a Dashboard" of ConceptDraw Solution Park.
The template "Project task status dashboard" for the ConceptDraw PRO diagramming and vector drawing software is included in the Status Dashboard solution from the area "What is a Dashboard" of ConceptDraw Solution Park.
Project task status dashboard template
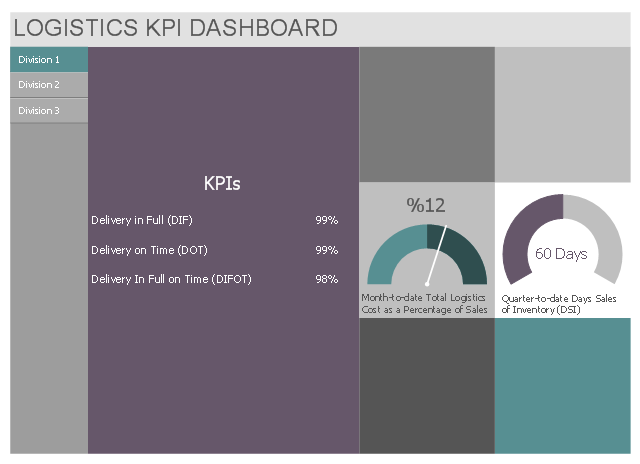
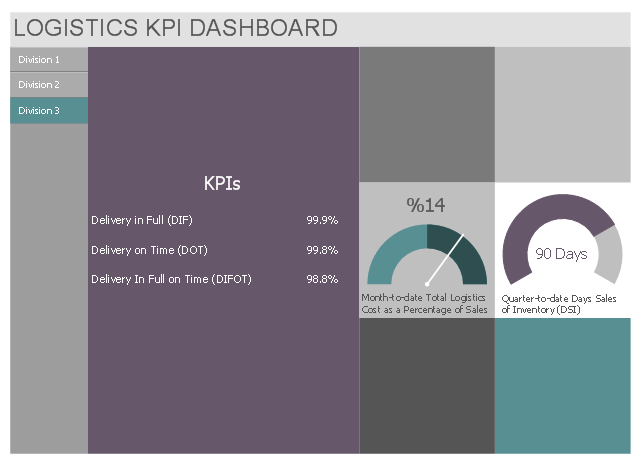
This multipage business dashboard template contains navigation vertical menu and graphic indicators of logistic key performance indicators (KPIs) and business metrics.
Use it to create your logistic KPI dashboard with ConceptDraw PRO software.
The performance dashboard template "Logistics KPI Dashboard" is included in Logistic Dashboard solution from Business Processes area of ConceptDraw Solution Park.
Use it to create your logistic KPI dashboard with ConceptDraw PRO software.
The performance dashboard template "Logistics KPI Dashboard" is included in Logistic Dashboard solution from Business Processes area of ConceptDraw Solution Park.
Division 1
Division 2
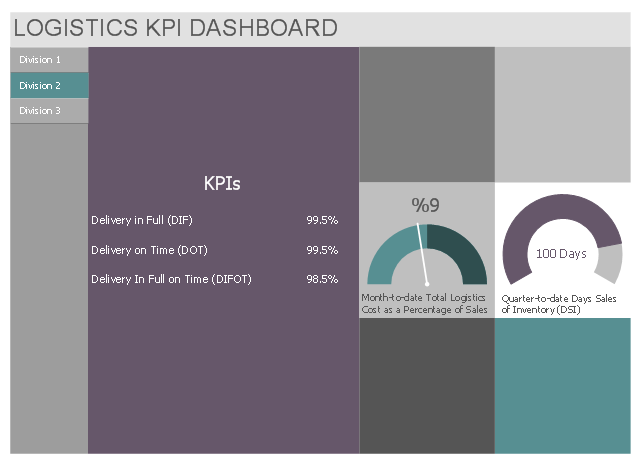
Division 3
- Weekly Dashboard Template
- Sales Dashboard Template | KPI Dashboard | KPIs and Metrics | Ppt ...
- Sales Dashboard Examples | Visualize Sales Data Using Sample ...
- Sales Dashboard Template | Business Intelligence Dashboard ...
- Daily Sales Dashboard Template
- Project task status dashboard - Template | Status Dashboard | PM ...
- Progress Dashboard Examples
- Product Comparison Dashboard Template Website
- Excel Dashboard Templates For Bank Solution
- Multiple Project Dashboard Template Excel
- ERD | Entity Relationship Diagrams, ERD Software for Mac and Win
- Flowchart | Basic Flowchart Symbols and Meaning
- Flowchart | Flowchart Design - Symbols, Shapes, Stencils and Icons
- Flowchart | Flow Chart Symbols
- Electrical | Electrical Drawing - Wiring and Circuits Schematics
- Flowchart | Common Flowchart Symbols
- Flowchart | Common Flowchart Symbols