Basic Flowchart Symbols and Meaning


This picture bar graph sample shows the computer and Internet use at home from 1984 to 2014. It was designed using data from website of the United States Census Bureau (USCB).
[census.gov/ content/ dam/ Census/ library/ visualizations/ 2016/ comm/ digital_ nation.png]
"Home automation is the residential extension of building automation and involves the control and automation of lighting, heating, ventilation, air conditioning (HVAC), appliances, and security. Modern systems generally consist of switches and sensors connected to a central hub sometimes called a "gateway" from which the system is controlled with a user interface that is interacted either with a wall-mounted terminal, mobile phone software, tablet computer or a web interface." [Home automation. Wikipedia]
The pictorial chart example "Computer and Internet use at home over time" was created using the ConceptDraw PRO diagramming and vector drawing software extended with the Picture Graphs solution from the Graphs and Charts area of ConceptDraw Solution Park.
Image chart

Process Flowchart


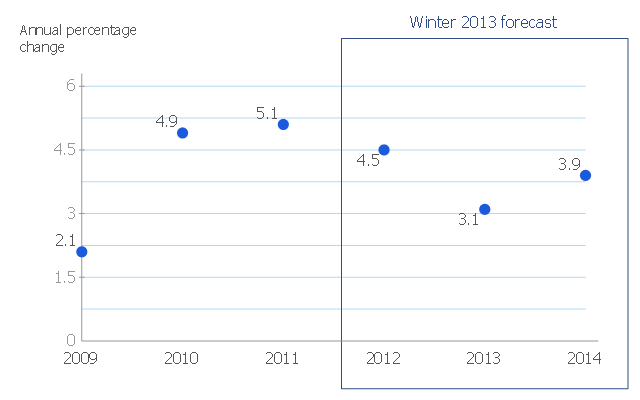
This scatter chart sample shows the MENA's (Middle East and North Africa's) real GDP growth. It was designed on the base scatter graph from the website of the European Economic Forecast (EUROPEAN ECONOMY 1|2013, Economic and Financial Affairs Winter 2013, European Commission). [ec.europa.eu/ economy_ finance/ publications/ european_ economy/ 2013/ pdf/ ee1_ en.pdf]
"The term MENA, for "Middle East and North Africa", is an acronym often used in academic, military planning, disaster relief, and business writing.
Due to the geographic ambiguity and Eurocentric nature of the term "Middle East", many people prefer use of the term WANA (West Asia and North Africa) or the less common NAWA (North Africa-West Asia).
The term covers an extensive region, extending from Morocco to Iran, including the majority of both the Middle Eastern and Maghreb countries. The term is roughly synonymous with the term the Greater Middle East. ...
MENA has no standardized definition; different organizations define the region as consisting of different territories. The following is a list of commonly included countries and territories: Bahrain, Egypt, Iran, Iraq, Israel, Jordan, Kuwait, Lebanon, Yemen, United Arab Emirates, Libya, Morocco, Oman, West Bank and Gaza, Qatar, Saudi Arabia, Syria, Tunisia, Algeria.
Sometimes also included in broader definitions: Armenia, Azerbaijan, Cyprus, Djibouti, Mauritania, Somalia, Sudan, Turkey, Western Sahara." [MENA. Wikipedia]
The scatter chart example "Middle East and North Africa's real GDP growth" was created using the ConceptDraw PRO diagramming and vector drawing software extended with the Line Graphs solution from the Graphs and Charts area of ConceptDraw Solution Park.
Scatter graph
Basic Diagramming Flowchart Software

 Line Graphs
How to draw a Line Graph with ease? The Line Graphs solution extends the capabilities of ConceptDraw PRO v10 with professionally designed templates, samples, and a library of vector stencils for drawing perfect Line Graphs.
Chart Examples

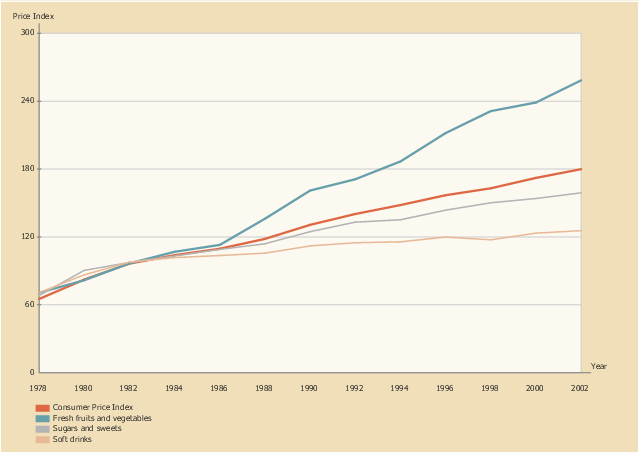
This line graph sample shows the relative price changes for fresh fruits and vegetables, sugars and sweets, and soft drinks, using the period 1982–84 as the baseline (index = 100), 1978–2002. It was designed on the base of line chart from the website of the U.S. National Center for Chronic Disease Prevention and Health Promotion.
"The number of overweight and obese youth has increased in recent decades, yet few data assess how the lives of children have changed during the “obesity epidemic.” ...
Eating as a primary activity declined, suggesting a shift toward snacking or eating as a secondary activity. Statistically significant trends exist for carbohydrate intake, especially for chips/ crackers/ popcorn/ pretzels (intake tripled from the mid-1970s to the mid-1990s) and soft drinks (intake doubled during the same period). Price and income data suggest possible economic reasons for these changes. The percentage of disposable income spent on food has declined continuously, and almost all of the decline has been represented by food consumed at home, yet today’s disposable income buys more calories than it has in the past. Relative prices have encouraged shifts across food types. From a baseline of 100 during 1982–84, the price index for fresh fruit and vegetables increased to 258 by 2002 (far exceeding general inflation), whereas the price index for soft drinks increased only to 126 by 2002 (below general inflation)." [cdc.gov/ pcd/ issues/ 2005/ apr/ 04_ 0039.htm]
The line chart example "Relative price changes for fresh fruits and vegetables, sugars, sweets, soft drinks" was created using the ConceptDraw PRO diagramming and vector drawing software extended with the Line Graphs solution from the Graphs and Charts area of ConceptDraw Solution Park.
Line chart
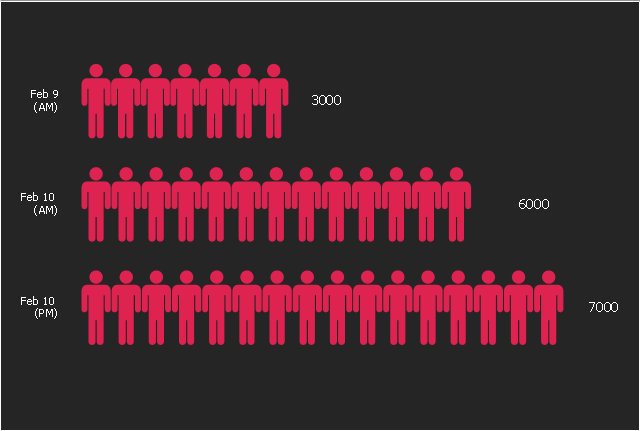
This picture bar graph sample shows increse in subscibers on YouTube to Anonymous' videos in 2008. It was designed on the base of the Wikimedia Commons file: A graph to show the increse in subscibers on YouTube to Anonymous' videos.jpg. [commons.wikimedia.org/ wiki/ File:A_ graph_ to_ show_ the_ increse_ in_ subscibers_ on_ YouTube_ to_ Anonymous%27_ videos.jpg]
This file is licensed under the Creative Commons Attribution 3.0 Unported license. [creativecommons.org/ licenses/ by/ 3.0/ deed.en]
"Anonymous (used as a mass noun) is a loosely associated international network of activist and hacktivist entities. A website nominally associated with the group describes it as "an internet gathering" with "a very loose and decentralized command structure that operates on ideas rather than directives". The group became known for a series of well-publicized publicity stunts and distributed denial-of-service (DDoS) attacks on government, religious, and corporate websites.
Anonymous originated in 2003 on the imageboard 4chan, representing the concept of many online and offline community users simultaneously existing as an anarchic, digitized global brain. Anonymous members (known as "Anons") can be distinguished in public by the wearing of stylised Guy Fawkes masks." [Anonymous (group). Wikipedia]
The pictorial chart example "The increse in subscibers on YouTube to Anonymous' videos" was created using the ConceptDraw PRO diagramming and vector drawing software extended with the Picture Graphs solution from the Graphs and Charts area of ConceptDraw Solution Park.
Image chart
 ConceptDraw Solution Park
ConceptDraw Solution Park collects graphic extensions, examples and learning materials
Chart Templates

Line Chart Examples

This double bar chart sample shows the nitrate concentration in milligrams per liter in Community Water Systems (CWS), mean and maximum by year, in New Mexico in 1999-2015. It was drawn using data from the New Mexico's Indicator-Based Information System (NM-IBIS) website. [ibis.health.state.nm.us/ indicator/ complete_ profile/ CommWaterNitrates.html]
"Nitrate toxicity is a preventable cause of methemoglobinemia (blue baby syndrome), especially in infants. Infants younger than 4 months of age are at greatest risk of toxicity from nitrate-contaminated drinking water.
These infants are more susceptible to developing methemoglobinemia because the pH of their gut is normally higher (less acidic) than in older children and adults. The higher pH enhances the conversion of ingested nitrate to the more toxic nitrite. The bacterial flora of a young infant's gut is also different from that found in older children and adults and might be more likely to convert ingested nitrate to nitrite. Gastroenteritis can increase body transformation of nitrate to nitrite and absorption into the bloodstream of nitrite from the large intestine.
A large proportion of hemoglobin in young infants is in the form of fetal hemoglobin. Fetal hemoglobin is more readily oxidized to methemoglobin (MHg) by nitrites than is adult hemoglobin. In addition, in infants, the enzyme (NADH-dependent methemoglobin reductase) responsible for reduction of formed MHg back to normal hemoglobin has only about half the activity it has in adults.
Symptoms such as shortness of breath and bluish skin coloring around the mouth, hands, or feet, can occur in infants rapidly over a period of days. If the condition is severe, it could lead to convulsions, coma, and even death, if untreated. Most older children and adults can take in larger amounts of nitrate without experiencing the same health effects as infants. However, pregnant women, nursing mothers, and people with low stomach acid conditions or those deficient in an enzyme that changes MHg back to normal hemoglobin are more susceptible to nitrate-induced methemoglobinemia and could be affected by water with nitrate levels above 10 mg/ L.
Adverse reproductive outcomes such as spontaneous abortions, intrauterine growth retardation, and various birth defects such as anencephaly have been reported in scientific literature from exposure to high nitrate levels in drinking water; however, the evidence is inconsistent.
Little is known about possible health effects from high nitrate level exposure over a long period of time. However, some studies suggest that there might be a risk of stomach, esophageal or bladder cancers in people with prolonged ingestion of high levels of nitrate. This might be due to the formation of nitrosoamines in the body following ingestion exposure to high levels of nitrate.
International Agency for Research on Cancer (IARC) classified ingested nitrate or nitrite as probably carcinogenic to humans (Group 2A) under conditions that result in formation of nitroso-compounds (e.g., nitrosoamines) in the body (endogenous nitrosation)." [ibis.health.state.nm.us/ indicator/ view/ CommWaterNitrates.MeanMax.Year.html]
The column chart example "Nitrate concentration in Community Water Systems (CWS)" was created using the ConceptDraw PRO diagramming and vector drawing software extended with the Bar Graphs solution from the Graphs and Charts area of ConceptDraw Solution Park.
Double bar graph
.png--diagram-flowchart-example.png)
- Graph Chart Website Template
- Website Graph
- Website For Pie Chart Making
- Company website home (mockup) | Chart Examples | Website ...
- Web Graph Creator
- Website metrics - Visual dashboard | Construction Project Chart ...
- Data Dashboard Pie Chart
- Scatter Plot | Scatter Graph | Make a Scatter Plot | Scatter Plot
- Download Free Html Website Template With Charts And Graphs
- Bar Graph | Global competitiveness index infrastructure score | Bar ...
- Web Page Graph Templates
- Chart Website Template
- Example Of A Grant Chart For Website Development
- Status Dashboard | Composition Dashboard | Website Wireframe ...
- Website Design Flowchart Example
- Spider Chart Template | Flowchart Software | Chart Maker for ...
- Bar Chart Examples | Double bar graph - Template | Column Chart ...
- Arrows Bar Chart
- Chart Website
- Scatter Chart Examples | Scatter Plot | Make a Scatter Plot | Example ...
- ERD | Entity Relationship Diagrams, ERD Software for Mac and Win
- Flowchart | Basic Flowchart Symbols and Meaning
- Flowchart | Flowchart Design - Symbols, Shapes, Stencils and Icons
- Flowchart | Flow Chart Symbols
- Electrical | Electrical Drawing - Wiring and Circuits Schematics
- Flowchart | Common Flowchart Symbols
- Flowchart | Common Flowchart Symbols