 Website Wireframe
The innovative Website Wireframe solution enhances the ConceptDraw DIAGRAM functionality with newest wireframe tools, libraries with variety of predesigned icons, symbols, buttons, graphics, forms, boxes, and many other vector elements, templates and professionally designed samples, which make it the best wireframing software. Website Wireframe solution gives you significant advantages when designing and maintaining websites, creating skeletal and content-free depictions of website structure, making website prototypes and planning the content arrangement before committing to design, also speeds up the processes of sketching, producing and sharing wireframe examples of website style and interface design.
HelpDesk
How to Develop Website Wireframes

"A website, also written as Web site, web site, or simply site, is a set of related web pages served from a single web domain. A website is hosted on at least one web server, accessible via a network such as the Internet or a private local area network through an Internet address known as a Uniform resource locator. All publicly accessible websites collectively constitute the World Wide Web.
A webpage is a document, typically written in plain text interspersed with formatting instructions of Hypertext Markup Language (HTML, XHTML). A webpage may incorporate elements from other websites with suitable markup anchors.
Webpages are accessed and transported with the Hypertext Transfer Protocol (HTTP), which may optionally employ encryption (HTTP Secure, HTTPS) to provide security and privacy for the user of the webpage content. The user's application, often a web browser, renders the page content according to its HTML markup instructions onto a display terminal.
The pages of a website can usually be accessed from a simple Uniform Resource Locator (URL) called the web address. The URLs of the pages organize them into a hierarchy, although hyperlinking between them conveys the reader's perceived site structure and guides the reader's navigation of the site which generally includes a home page with most of the links to the site's web content, and a supplementary about, contact and link page." [Website. Wikipedia]
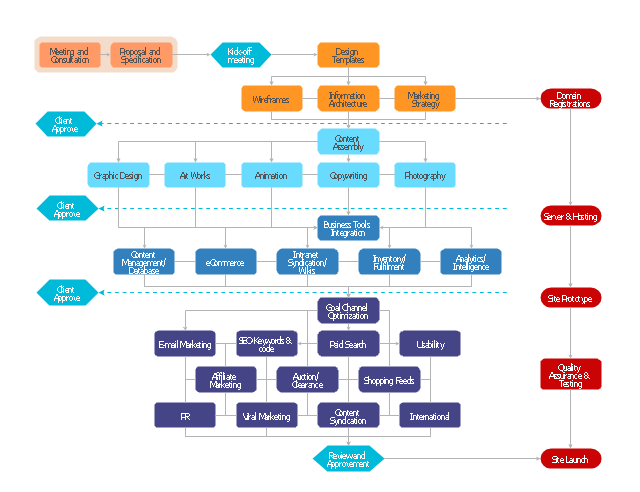
The flow chart example "Website launch" was created using the ConceptDraw PRO diagramming and vector drawing software extended with the Flowcharts solution from the area "What is a Diagram" of ConceptDraw Solution Park.
A webpage is a document, typically written in plain text interspersed with formatting instructions of Hypertext Markup Language (HTML, XHTML). A webpage may incorporate elements from other websites with suitable markup anchors.
Webpages are accessed and transported with the Hypertext Transfer Protocol (HTTP), which may optionally employ encryption (HTTP Secure, HTTPS) to provide security and privacy for the user of the webpage content. The user's application, often a web browser, renders the page content according to its HTML markup instructions onto a display terminal.
The pages of a website can usually be accessed from a simple Uniform Resource Locator (URL) called the web address. The URLs of the pages organize them into a hierarchy, although hyperlinking between them conveys the reader's perceived site structure and guides the reader's navigation of the site which generally includes a home page with most of the links to the site's web content, and a supplementary about, contact and link page." [Website. Wikipedia]
The flow chart example "Website launch" was created using the ConceptDraw PRO diagramming and vector drawing software extended with the Flowcharts solution from the area "What is a Diagram" of ConceptDraw Solution Park.
Flowchart - Website launch
"Web analytics is the measurement, collection, analysis and reporting of internet data for purposes of understanding and optimizing web usage.
Web analytics is not just a tool for measuring web traffic but can be used as a tool for business and market research, and to assess and improve the effectiveness of a web site. Web analytics applications can also help companies measure the results of traditional print or broadcast advertising campaigns. It helps one to estimate how traffic to a website changes after the launch of a new advertising campaign. Web analytics provides information about the number of visitors to a website and the number of page views. It helps gauge traffic and popularity trends which is useful for market research.
There are two categories of web analytics; off-site and on-site web analytics.
Off-site web analytics refers to web measurement and analysis regardless of whether you own or maintain a website.
On-site web analytics measure a visitor's behavior once on your website. This includes its drivers and conversions; for example, the degree to which different landing pages are associated with online purchases. On-site web analytics measures the performance of your website in a commercial context. This data is typically compared against key performance indicators for performance, and used to improve a web site or marketing campaign's audience response." [Web analytics. Wikipedia]
The example "Website metrics - Visual dashboard" was created using the ConceptDraw PRO diagramming and vector drawing software extended with the Composition Dashboard solution from the area "What is a Dashboard" of ConceptDraw Solution Park.
Visual dashboard
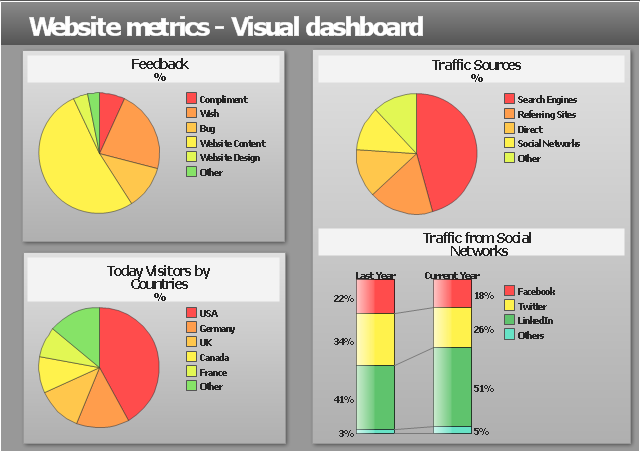
This example visual dashboard example shows website traffic metrics. Divided bar chart and pie chart are used to visualize compositional data. Scatter plot is used to visually analyse correlation between two data sets.
"Web traffic is the amount of data sent and received by visitors to a web site. ...
This is determined by the number of visitors and the number of pages they visit. Sites monitor the incoming and outgoing traffic to see which parts or pages of their site are popular and if there are any apparent trends, such as one specific page being viewed mostly by people in a particular country. There are many ways to monitor this traffic and the gathered data is used to help structure sites, highlight security problems or indicate a potential lack of bandwidth not all web traffic is welcome. Some companies offer advertising schemes that, in return for increased web traffic (visitors), pay for screen space on the site. Sites also often aim to increase their web traffic through inclusion on search engines and through search engine optimization." [Web traffic. Wikipedia]
The example "Website traffic dashboard" was created using the ConceptDraw PRO diagramming and vector drawing software extended with the Corellation Dashboard solution from the area "What is a Dashboard" of ConceptDraw Solution Park.
Visual dashboard

"Microsoft SharePoint is a Web application platform developed by Microsoft. First launched in 2001, SharePoint has historically been associated with intranet, content management and document management, but recent versions have significantly broader capabilities.
SharePoint comprises a multipurpose set of Web technologies backed by a common technical infrastructure. By default, SharePoint has a Microsoft Office-like interface, and it is closely integrated with the Office suite. The web tools are designed to be usable by non-technical users. SharePoint can be used to provide intranet portals, document & file management, collaboration, social networks, extranets, websites, enterprise search, and business intelligence. It also has system integration, process integration, and workflow automation capabilities.
Enterprise application software (e.g. ERP or CRM packages) often provide some SharePoint integration capability, and SharePoint also incorporates a complete development stack based on web technologies and standards-based APIs. As an application platform, SharePoint provides central management, governance, and security controls for implementation of these requirements. The SharePoint platform integrates directly into IIS - enabling bulk management, scaling, and provisioning of servers, as is often required by large organizations or cloud hosting providers." [Microsoft SharePoint. Wikipedia]
The AWS architecture diagram example "SharePoint server reference architecture for public-facing website scenario" was created using the ConceptDraw PRO diagramming and vector drawing software extended with the AWS Architecture Diagrams solution from the Computer and Networks area of ConceptDraw Solution Park.
AWS architecture diagram

Flowchart

Wireframe Examples
"A user profile is a visual display of personal data associated with a specific user, or a customized desktop environment. A profile refers therefore to the explicit digital representation of a person's identity. A user profile can also be considered as the computer representation of a user model.
A profile can be used to store the description of the characteristics of person. This information can be exploited by systems taking into account the persons' characteristics and preferences.
Profiling is the process that refers to construction of a profile via the extraction from a set of data.
User profiles can be found on operating systems, computer programs, recommender systems, or dynamic websites (such as online social networking sites or bulletin boards)." [User profile. Wikipedia]
The example "Website user profile" was created using the ConceptDraw PRO diagramming and vector drawing software extended with the People solution from the Illustration area of ConceptDraw Solution Park.
User profile

"A performance indicator or key performance indicator (KPI) is a type of performance measurement. An organization may use KPIs to evaluate its success, or to evaluate the success of a particular activity in which it is engaged. Sometimes success is defined in terms of making progress toward strategic goals, but often success is simply the repeated, periodic achievement of some level of operational goal (e.g. zero defects, 10/ 10 customer satisfaction, etc.). Accordingly, choosing the right KPIs relies upon a good understanding of what is important to the organization. 'What is important' often depends on the department measuring the performance - e.g. the KPIs useful to finance will be quite different from the KPIs assigned to sales. Since there is a need to understand well what is important (to an organization), various techniques to assess the present state of the business, and its key activities, are associated with the selection of performance indicators. These assessments often lead to the identification of potential improvements, so performance indicators are routinely associated with 'performance improvement' initiatives." [Performance indicator. Wikipedia]
The example "Website KPIs - Visual dashboard" was created using the ConceptDraw PRO diagramming and vector drawing software extended with the Composition Dashboard solution from the area "What is a Dashboard" of ConceptDraw Solution Park.
The example "Website KPIs - Visual dashboard" was created using the ConceptDraw PRO diagramming and vector drawing software extended with the Composition Dashboard solution from the area "What is a Dashboard" of ConceptDraw Solution Park.
Visual dashboard

Interface Design
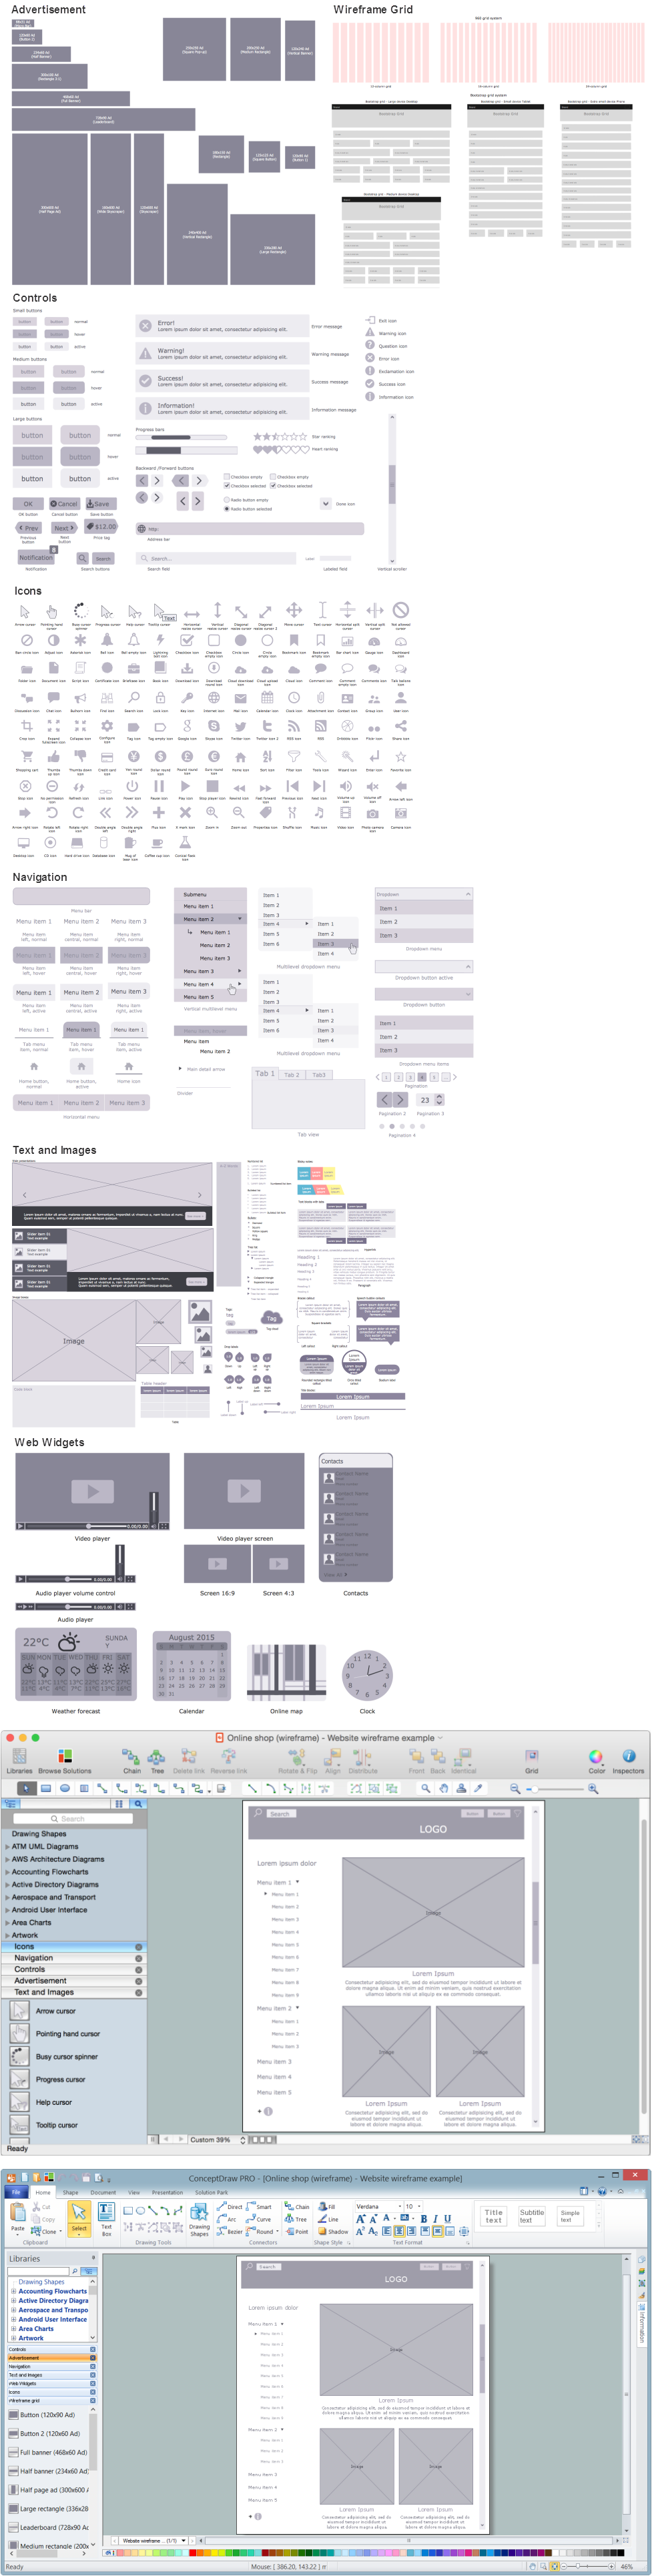
ConceptDraw DIAGRAM software offers a unique Website Wireframe solution from the Software Development area with all needed tools for fast and easy drawing professional looking website wireframe with attractive interface design.
Wireframing
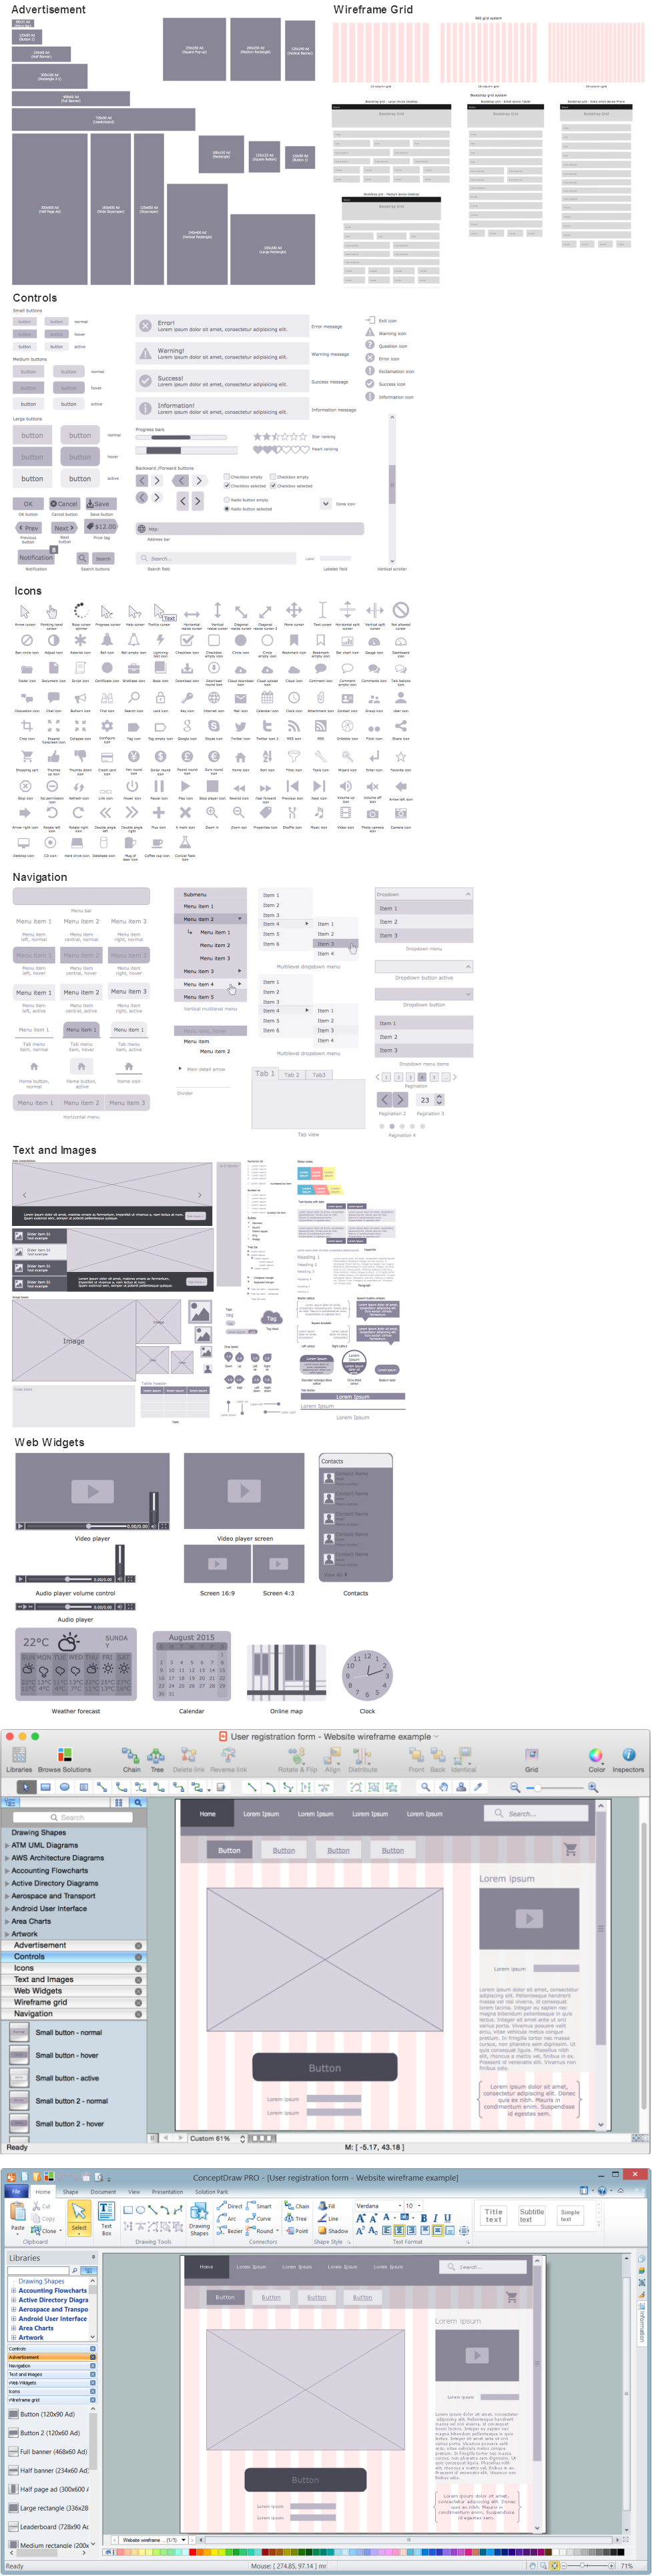
ConceptDraw DIAGRAM extended with Website Wireframe solution from the Software Development area is the best wireframing software. Using the wireframe tools, libraries of vector objects, template and examples which offers a Website Wireframe solution, you will easily design the websites wireframes of any complexity.
Wireframe Tools

- Conceptdraw.com: Mind Map Software, Drawing Tools | Project ...
- Website Design Flowchart Example
- Website Process Flow Chart
- Website launch - Flowchart
- Website Diagram
- Flowchart | Example Process Flow | Accounting Flowcharts | Website ...
- Design elements - Wireframe | How to Develop Website Wireframes ...
- Flowchart Examples Website Development Project
- Website Wireframe | Online shop (wireframe) | Wireframing | Online ...
- Diagram Website
- Website launch - Flowchart | Website Wireframe | Website traffic ...
- Basic Flowchart Symbols and Meaning | Flowchart | Website launch ...
- Website metrics - Visual dashboard | Website traffic dashboard ...
- Wireframing | 960 Grid System 16-column layout | Website ...
- Design elements - Navigation | Website Wireframe | Wireframing ...
- Process Flowchart | Interface Design | Data Flow Diagrams | Website ...
- Website Wireframe | Online shop (wireframe) | Wireframing | Website ...
- Website Wireframe | Wireframe Tools | 960 Grid System 16-column ...
- Photo gallery webpage (wireframe) | Website Wireframe | Wireframe ...
- Website Wireframe | How to Develop Website Wireframes Using ...
- ERD | Entity Relationship Diagrams, ERD Software for Mac and Win
- Flowchart | Basic Flowchart Symbols and Meaning
- Flowchart | Flowchart Design - Symbols, Shapes, Stencils and Icons
- Flowchart | Flow Chart Symbols
- Electrical | Electrical Drawing - Wiring and Circuits Schematics
- Flowchart | Common Flowchart Symbols
- Flowchart | Common Flowchart Symbols