Example of DFD for Online Store (Data Flow Diagram)

Example of DFD for Online Store shows the Data Flow Diagram for online store and interactions between the Visitors, Customers and Sellers, as well as Website Information and User databases.

Online Diagram Tool
"Online shopping or e-shopping is a form of electronic commerce which allows consumers to directly buy goods or services from a seller over the Internet using a web browser. Alternative names are: e-web-store, e-shop, e-store, Internet shop, web-shop, web-store, online store, online storefront and virtual store. Mobile commerce (or m-commerce) describes purchasing from an online retailer's mobile optimized online site or app.
An online shop evokes the physical analogy of buying products or services at a bricks-and-mortar retailer or shopping center; the process is called business-to-consumer (B2C) online shopping. In the case where a business buys from another business, the process is called business-to-business (B2B) online shopping. The largest of these online retailing corporations are Alibaba, Amazon.com, and eBay. Retail success is no longer all about physical stores. This is evident because of the increase in retailers now offering online store interfaces for consumers. With the growth of online shopping, comes a wealth of new market footprint coverage opportunities for stores that can appropriately cater to offshore market demands and service requirements." [Online shopping. Wikipedia]
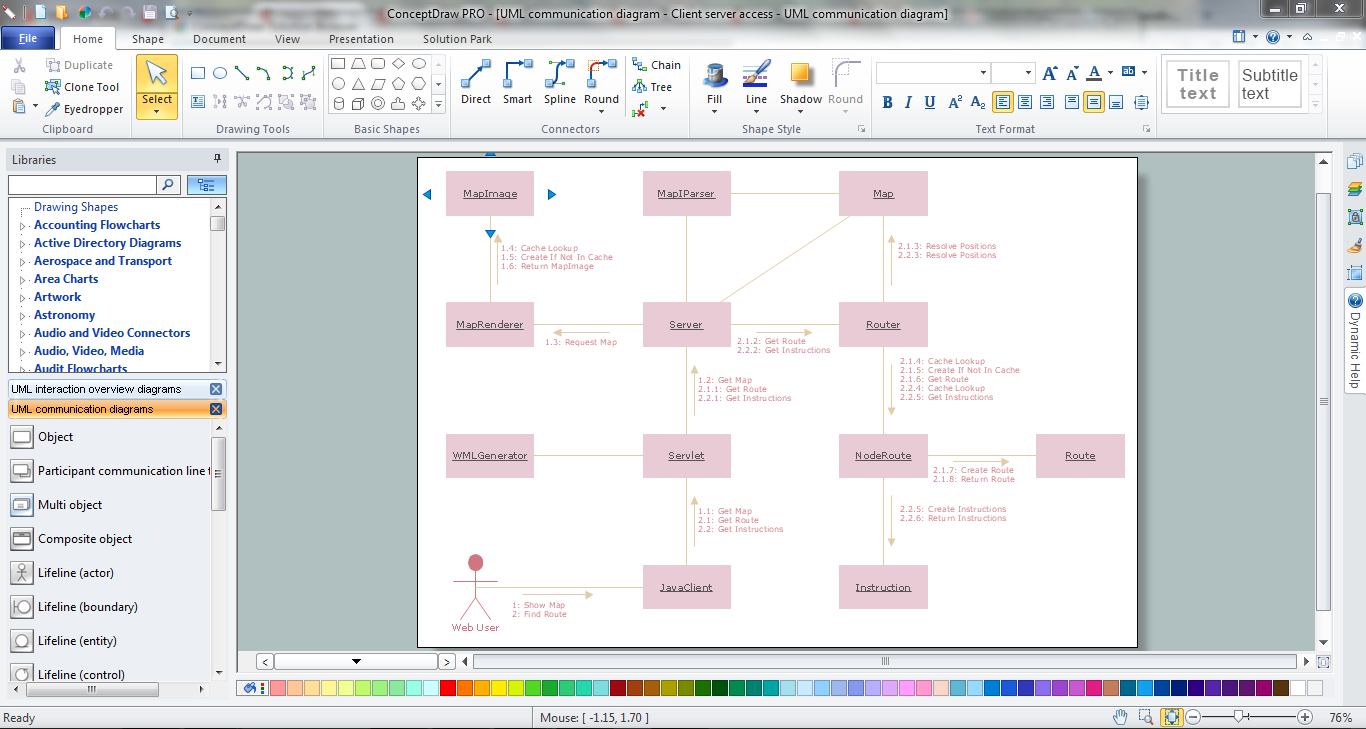
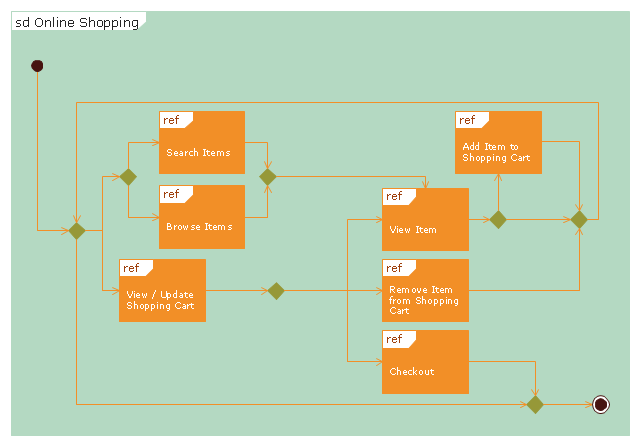
The UML interaction overview diagram example "Online shopping" was created using the ConceptDraw PRO diagramming and vector drawing software extended with the Rapid UML solution from the Software Development area of ConceptDraw Solution Park.
An online shop evokes the physical analogy of buying products or services at a bricks-and-mortar retailer or shopping center; the process is called business-to-consumer (B2C) online shopping. In the case where a business buys from another business, the process is called business-to-business (B2B) online shopping. The largest of these online retailing corporations are Alibaba, Amazon.com, and eBay. Retail success is no longer all about physical stores. This is evident because of the increase in retailers now offering online store interfaces for consumers. With the growth of online shopping, comes a wealth of new market footprint coverage opportunities for stores that can appropriately cater to offshore market demands and service requirements." [Online shopping. Wikipedia]
The UML interaction overview diagram example "Online shopping" was created using the ConceptDraw PRO diagramming and vector drawing software extended with the Rapid UML solution from the Software Development area of ConceptDraw Solution Park.
UML interaction overview diagram
UML Component Diagram Example - Online Shopping

This sample shows the concept of the online shopping and is used for the understanding of the online shopping processes, of the online shops working processes, for projection and creating of the online stores.
Flow Chart Online

State Diagram Example — Online Store

This sample shows the work of the online store and can be used for the understanding of the online shopping processes, for projection and creating of the online store.
Online Flow Chart

Entity Relationship Diagram - ERD - Software for Design Crows Foot ER Diagrams
_Win_Mac.png)

Amazon Web Services Diagrams diagramming tool for architecture

 ConceptDraw Solution Park
ConceptDraw Solution Park collects graphic extensions, examples and learning materials
Data Flow Diagram Software

ConceptDraw DIAGRAM is a powerful Data Flow Diagram Software thanks to the Data Flow Diagrams solution from the Software Development area of ConceptDraw Solution Park.
You can use the predesigned DFD vector objects that are grouped in 3 libraries of Data Flow Diagrams solution: Data Flow Diagrams Library; Gane-Sarson Notation Library; Yourdon and Coad Notation Library.
How to Create a Social Media DFD Flowchart

It allows companies to be more effective in timely messaging thanks to the ability for rapid response to a customer′s post in social media. This saves budget for companies who use social media for promoting and as a lead generation tool.
 Website Wireframe
The innovative Website Wireframe solution enhances the ConceptDraw DIAGRAM functionality with newest wireframe tools, libraries with variety of predesigned icons, symbols, buttons, graphics, forms, boxes, and many other vector elements, templates and professionally designed samples, which make it the best wireframing software. Website Wireframe solution gives you significant advantages when designing and maintaining websites, creating skeletal and content-free depictions of website structure, making website prototypes and planning the content arrangement before committing to design, also speeds up the processes of sketching, producing and sharing wireframe examples of website style and interface design.
Functional Block Diagram

 Event-driven Process Chain Diagrams
Event-Driven Process Chain Diagrams solution extends ConceptDraw DIAGRAM functionality with event driven process chain templates, samples of EPC engineering and modeling the business processes, and a vector shape library for drawing the EPC diagrams and EPC flowcharts of any complexity. It is one of EPC IT solutions that assist the marketing experts, business specialists, engineers, educators and researchers in resources planning and improving the business processes using the EPC flowchart or EPC diagram. Use the EPC solutions tools to construct the chain of events and functions, to illustrate the structure of a business process control flow, to describe people and tasks for execution the business processes, to identify the inefficient businesses processes and measures required to make them efficient.
- Online Web Diagram Maker
- State Diagram Example - Online Store | UML interaction overview ...
- Web Diagram Online
- Example of DFD for Online Store (Data Flow Diagram ) DFD ...
- Online Diagram Tool | Flow Chart Online | Amazon Web Services ...
- Online Diagram Tool
- Make A Web Diagram Online
- UML Diagram | UML interaction overview diagram - Online shopping ...
- Flow Chart Of Online Shopping Website
- UML interaction overview diagram - Online shopping | UML activity ...
- Amazon Web Services Diagrams diagramming tool for architecture
- State Diagram Example - Online Store | UML interaction overview ...
- UML Component Diagram Example - Online Shopping | UML ...
- Deployment Diagram For Website
- Online Diagram Tool | Flow Chart Online | UML Deployment ...
- UML Deployment Diagram Example
- Network Topology | Online Diagram Tool | Amazon Web Services ...
- Website Wireframe | Wireframing | Example of DFD for Online Store ...
- State Diagram Example - Online Store | UML Component Diagram ...
- Amazon Web Services Diagrams diagramming tool for architecture ...
- ERD | Entity Relationship Diagrams, ERD Software for Mac and Win
- Flowchart | Basic Flowchart Symbols and Meaning
- Flowchart | Flowchart Design - Symbols, Shapes, Stencils and Icons
- Flowchart | Flow Chart Symbols
- Electrical | Electrical Drawing - Wiring and Circuits Schematics
- Flowchart | Common Flowchart Symbols
- Flowchart | Common Flowchart Symbols