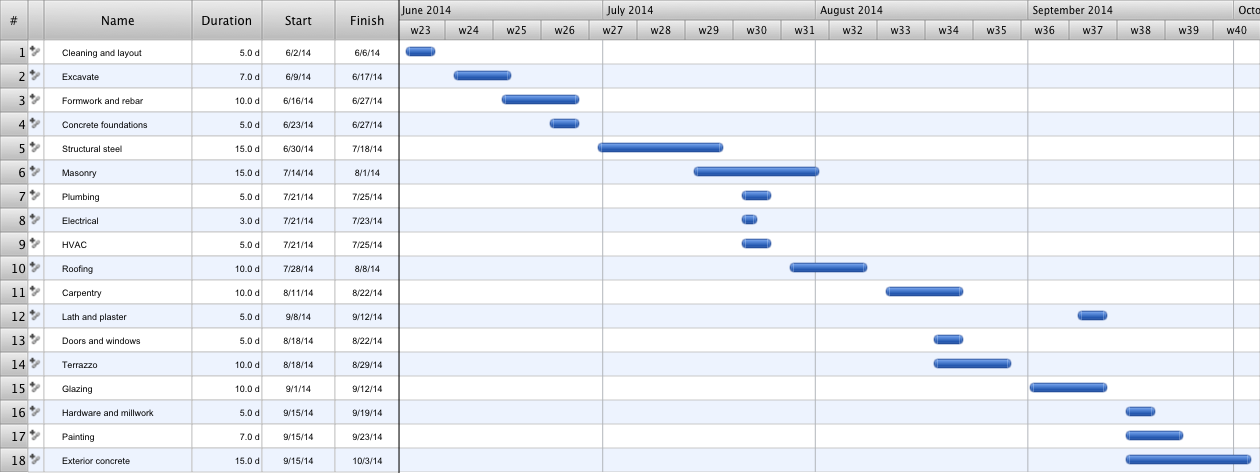
Gantt chart examples

Gantt chart examples
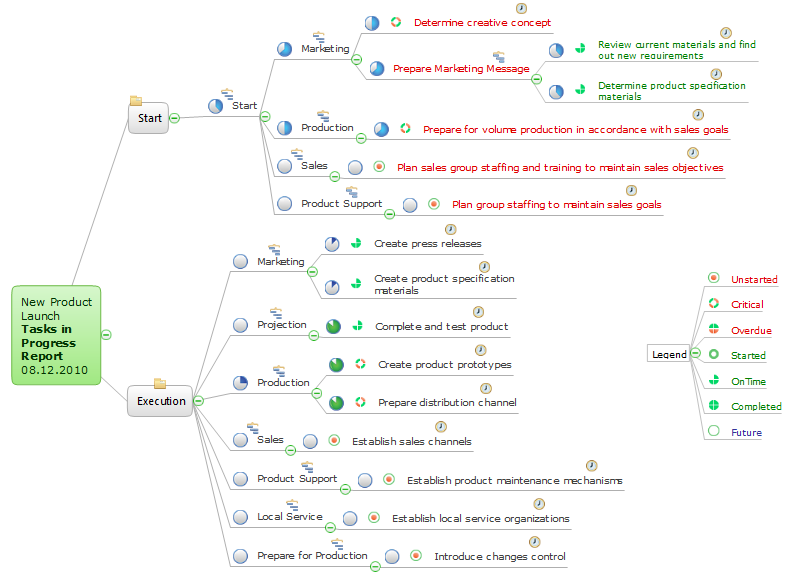
How To Show Project Progress Peport on Web

Gantt Chart Software

Basic Flowchart Symbols and Meaning


Business diagrams & Org Charts with ConceptDraw DIAGRAM


Advanced printing in ConceptDraw PROJECT

Flowchart Definition

Software Diagrams

ConceptDraw DIAGRAM is a perfect tool for Designing and planning tasks; Developing Visualization Solutions; Project Planning (Gantt Charts, Timelines, Project Schedules).
Construction Project Chart Examples
- Web Development Gantt Chart
- Business diagrams & Org Charts with ConceptDraw PRO | Flowchart ...
- Draw Gantt Chart For Development Of Library Information System
- Web Development Process Block Diagram
- Gantt Chart Website Development
- Web Gantt
- Gantt Chart For Software Development Sample
- Example of DFD for Online Store (Data Flow Diagram ) DFD ...
- Web Chart Of Resources
- Dfd For Supermarket Web Design Project
- ERD | Entity Relationship Diagrams, ERD Software for Mac and Win
- Flowchart | Basic Flowchart Symbols and Meaning
- Flowchart | Flowchart Design - Symbols, Shapes, Stencils and Icons
- Flowchart | Flow Chart Symbols
- Electrical | Electrical Drawing - Wiring and Circuits Schematics
- Flowchart | Common Flowchart Symbols
- Flowchart | Common Flowchart Symbols