This work flow chart sample was redesigned from the picture "Weather Forecast" from the article "Simulation Workflows".
[iaas.uni-stuttgart.de/ forschung/ projects/ simtech/ sim-workflows.php]
"(1) The weather is predicted for a particular geological area. Hence, the workflow is fed with a model of the geophysical environment of ground, air and water for a requested area.
(2) Over a specified period of time (e.g. 6 hours) several different variables are measured and observed. Ground stations, ships, airplanes, weather balloons, satellites and buoys measure the air pressure, air/ water temperature, wind velocity, air humidity, vertical temperature profiles, cloud velocity, rain fall, and more.
(3) This data needs to be collected from the different sources and stored for later access.
(4) The collected data is analyzed and transformed into a common format (e.g. Fahrenheit to Celsius scale). The normalized values are used to create the current state of the atmosphere.
(5) Then, a numerical weather forecast is made based on mathematical-physical models (e.g. GFS - Global Forecast System, UKMO - United Kingdom MOdel, GME - global model of Deutscher Wetterdienst). The environmental area needs to be discretized beforehand using grid cells. The physical parameters measured in Step 2 are exposed in 3D space as timely function. This leads to a system of partial differential equations reflecting the physical relations that is solved numerically.
(6) The results of the numerical models are complemented with a statistical interpretation (e.g. with MOS - Model-Output-Statistics). That means the forecast result of the numerical models is compared to statistical weather data. Known forecast failures are corrected.
(7) The numerical post-processing is done with DMO (Direct Model Output): the numerical results are interpolated for specific geological locations.
(8) Additionally, a statistical post-processing step removes failures of measuring devices (e.g. using KALMAN filters).
(9) The statistical interpretation and the numerical results are then observed and interpreted by meteorologists based on their subjective experiences.
(10) Finally, the weather forecast is visualized and presented to interested people." [iaas.uni-stuttgart.de/ forschung/ projects/ simtech/ sim-workflows.php]
The example "Workflow diagram - Weather forecast" was drawn using the ConceptDraw PRO diagramming and vector drawing software extended with the Workflow Diagrams solution from the Business Processes area of ConceptDraw Solution Park.
Work flow chart

This interactive voice response (IVR) diagram sample depicts the architecture of IVR systems. It was designed on the base of the Wikimedia Commons file: IVR-Systemarchitektur.png. [commons.wikimedia.org/ wiki/ File:IVR-Systemarchitektur.png]
This file is licensed under the Creative Commons Attribution-Share Alike 3.0 Unported license. [creativecommons.org/ licenses/ by-sa/ 3.0/ deed.en]
"DTMF decoding and speech recognition are used to interpret the caller's response to voice prompts. DTMF tones are entered via the telephone keypad. ...
Other technologies include using text-to-speech (TTS) to speak complex and dynamic information, such as e-mails, news reports or weather information. TTS is computer generated synthesized speech that is no longer the robotic voice traditionally associated with computers. Real voices create the speech in fragments that are spliced together (concatenated) and smoothed before being played to the caller.
An IVR can be deployed in several ways:
1. Equipment installed on the customer premises.
2. Equipment installed in the PSTN (public switched telephone network).
3. Application service provider (ASP) / hosted IVR.
IVR can be used to provide a more sophisticated voice mail experience to the caller. ...
An automatic call distributor (ACD) is often the first point of contact when calling many larger businesses. ...
IVR call flows are created in a variety of ways. A traditional IVR depended upon proprietary programming or scripting languages, whereas modern IVR applications are generated in a similar way to Web pages, using standards such as VoiceXML, CCXML, SRGS and SSML. ...
In telecommunications, an audio response unit (ARU) is a device that provides synthesized voice responses to DTMF keypresses by processing calls based on (a) the call-originator input, (b) information received from a database, and (c) information in the incoming call, such as the time of day.
ARUs increase the number of information calls handled and provide consistent quality in information retrieval." [Interactive voice response. Wikipedia]
The IVR diagram example "IVR systems architecture" was designed using ConceptDraw PRO diagramming and vector drawing software extended with the Interactive Voice Response Diagrams solution from the Computer and Networks area of ConceptDraw Solution Park.
IVR diagram

 Workflow Diagrams
Workflow Diagrams solution extends ConceptDraw PRO software with samples, templates and vector stencils library for drawing the work process flowcharts.
The vector stencils library "Weather" contains 17 weather clipart images for drawing illustrations on climate to show cloudiness, air temperature, precipitation, wind.
"Weather is the state of the atmosphere, to the degree that it is hot or cold, wet or dry, calm or stormy, clear or cloudy. Most weather phenomena occur in the troposphere, just below the stratosphere. Weather generally refers to day-to-day temperature and precipitation activity, whereas climate is the term for the average atmospheric conditions over longer periods of time. When used without qualification, "weather", is generally understood to mean the weather of Earth.
Weather is driven by air pressure (temperature and moisture) differences between one place and another. These pressure and temperature differences can occur due to the sun angle at any particular spot, which varies by latitude from the tropics. The strong temperature contrast between polar and tropical air gives rise to the jet stream. Weather systems in the mid-latitudes, such as extratropical cyclones, are caused by instabilities of the jet stream flow. Because the Earth's axis is tilted relative to its orbital plane, sunlight is incident at different angles at different times of the year. On Earth's surface, temperatures usually range ±40°C (−40°F to 100°F) annually. Over thousands of years, changes in Earth's orbit affect the amount and distribution of solar energy received by the Earth and influence long-term climate and global climate change." [Weather. Wikipedia]
The clip art example "Weather - Vector stencils library" was created using the ConceptDraw PRO diagramming and vector drawing software extended with the Nature solution from the Illustration area of ConceptDraw Solution Park.
www.conceptdraw.com/ solution-park/ illustrations-nature
Sunny

Cloudy

Overcast

Snow

Rain

Lightning

Hot

Warm

Frost

Mist

Strong wind

Flood

Tsunami

Dew

Hoar-frost

Earthquake

Snowflake

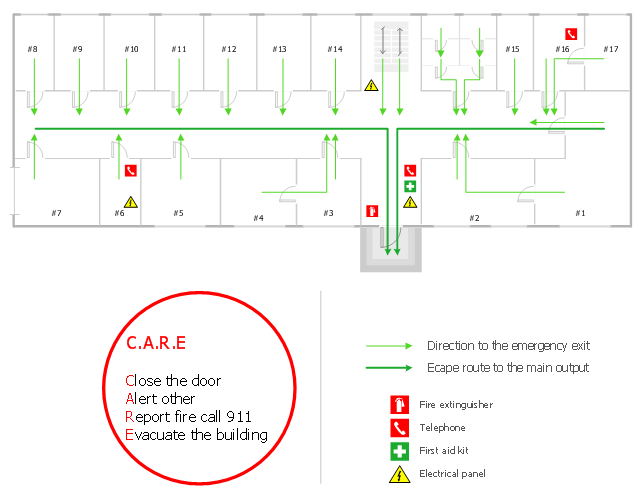
"Emergency evacuation is the immediate and urgent movement of people away from the threat or actual occurrence of a hazard. Examples range from the small scale evacuation of a building due to a storm or fire to the large scale evacuation of a district because of a flood, bombardment or approaching weather system. In situations involving hazardous materials or possible contamination, evacuees may be decontaminated prior to being transported out of the contaminated area. ...
Planning.
Emergency evacuation plans are developed to ensure the safest and most efficient evacuation time of all expected residents of a structure, city, or region. A benchmark "evacuation time" for different hazards and conditions is established. These benchmarks can be established through using best practices, regulations, or using simulations, such as modeling the flow of people in a building, to determine the benchmark. Proper planning will use multiple exits, contra-flow lanes, and special technologies to ensure full, fast and complete evacuation. Consideration for personal situations which may affect an individual's ability to evacuate is taken into account, including alarm signals that use both aural and visual alerts, and also evacuation equipment such as sleds, pads, and chairs for non-ambulatory people. Regulations such as building codes can be used to reduce the possibility of panic by allowing individuals to process the need to self-evacuate without causing alarm. Proper planning will implement an all-hazards approach so that plans can be reused for multiple hazards that could exist." [Emergency evacuation. Wikipedia]
The evacuation plan example was created using the ConceptDraw PRO diagramming and vector drawing software extended with the Fire and Emergency Plans solution from the Building Plans area of ConceptDraw Solution Park.
www.conceptdraw.com/ solution-park/ building-fire-emergency-plans
Evacuation plan
- Weather Forcast Png Images
- Lightning Weather Png
- Hydrologic Cycle Png
- Workflow diagram - Weather forecast | Workflow Diagram Software ...
- Mathematical Diagrams Png
- Weather - Vector stencils library | Food security assessment ...
- Water Flow Vector Png
- Reminders Png Icon
- Contact Mobile Png
- لوجو تليفون Png
- Horizontal Bar Chart Png
- Mic Icon Png
- Reminders Png
- Customer Png
- Report Clip Art
- Iphone Notes Icon Png
- Phone Logo Png
- Software Development | Water cycle diagram | Chore charts with ...
- IVR systems architecture | Call Forwarding with ENUM | IVR services ...
- IVR Systems | IVR systems architecture | Interactive Voice Response ...
- ERD | Entity Relationship Diagrams, ERD Software for Mac and Win
- Flowchart | Basic Flowchart Symbols and Meaning
- Flowchart | Flowchart Design - Symbols, Shapes, Stencils and Icons
- Flowchart | Flow Chart Symbols
- Electrical | Electrical Drawing - Wiring and Circuits Schematics
- Flowchart | Common Flowchart Symbols
- Flowchart | Common Flowchart Symbols