Waterfall Bar Chart

Network Topology Graphical Examples
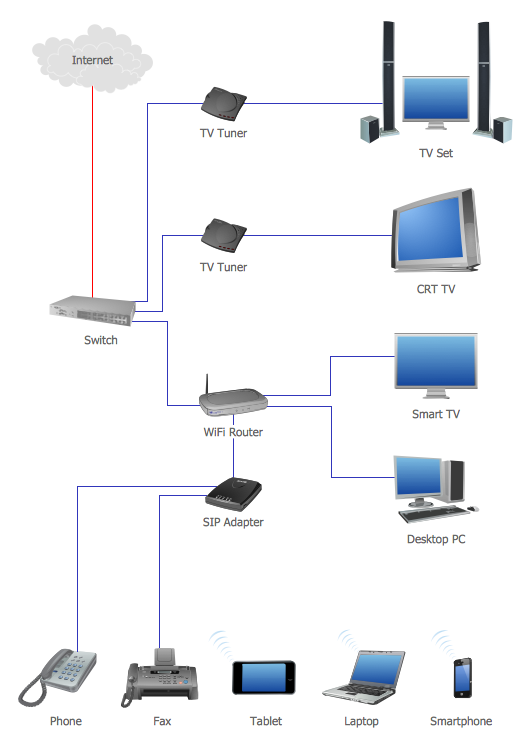
This example of computer network topology diagram shows home WLAN equipment and their connection to the Internet.
OOSE Method
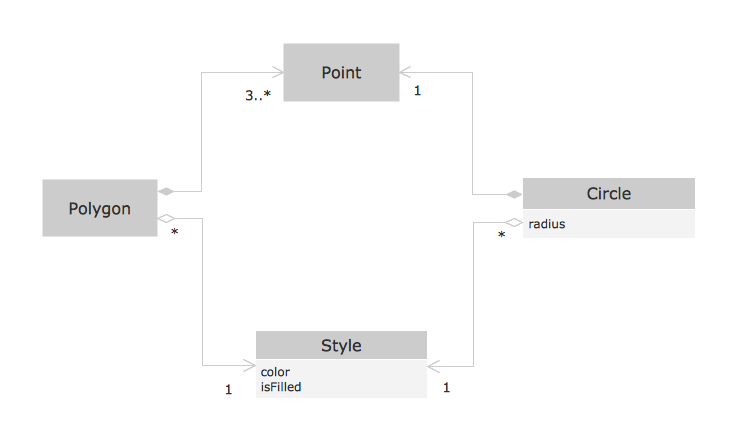
Using the Rapid UML Solution for ConceptDraw DIAGRAM you can create your own professional OOSE Diagrams quick and easy.
Data Flow Diagram

Context Diagram Template

This template shows the Context Diagram. It was created in ConceptDraw DIAGRAM diagramming and vector drawing software using the Block Diagrams Solution from the “Diagrams” area of ConceptDraw Solution Park.
The context diagram graphically identifies the system. external factors, and relations between them. It’s a high level view of the system. The context diagrams are widely used in software engineering and systems engineering for designing the systems that process the information.
UML Diagram Visio

Using the 13 libraries of the Rapid UML Solution for ConceptDraw DIAGRAM you can create your own visual vector UML diagrams quick and easy.
Pyramid Diagram

ConceptDraw DIAGRAM Compatibility with MS Visio

Gane Sarson Diagram

Diagramming Software for Design UML Use Case Diagrams


- Bar Chart Template for Word | Waterfall Bar Chart | Column Chart ...
- Waterfall Bar Chart | Export from ConceptDraw MINDMAP to ...
- Waterfall Powerpoint
- How to Create PowerPoint Presentation from Data Driven ...
- Waterfall Bar Chart | Atmosphere air composition | Export from ...
- How to Add a Block Diagram to a PowerPoint Presentation Using ...
- Atmosphere air composition | Waterfall Bar Chart | Pie Graph ...
- Examples for OOSE Method | OOSE Method | Waterfall Bar Chart ...
- Percentage Pie Chart. Pie Chart Examples | Export from ...
- Comparison Template Ppt
- ERD | Entity Relationship Diagrams, ERD Software for Mac and Win
- Flowchart | Basic Flowchart Symbols and Meaning
- Flowchart | Flowchart Design - Symbols, Shapes, Stencils and Icons
- Flowchart | Flow Chart Symbols
- Electrical | Electrical Drawing - Wiring and Circuits Schematics
- Flowchart | Common Flowchart Symbols
- Flowchart | Common Flowchart Symbols