Example Process Flow

ConceptDraw DIAGRAM is a Process Flowcharts software. This software includes basic package of process flow examples. The software contains object libraries with vector stencils that allows you use RapidDraw technology. By clicking on direction arrows you can add a new object to the flowchart.
Waterfall Bar Chart

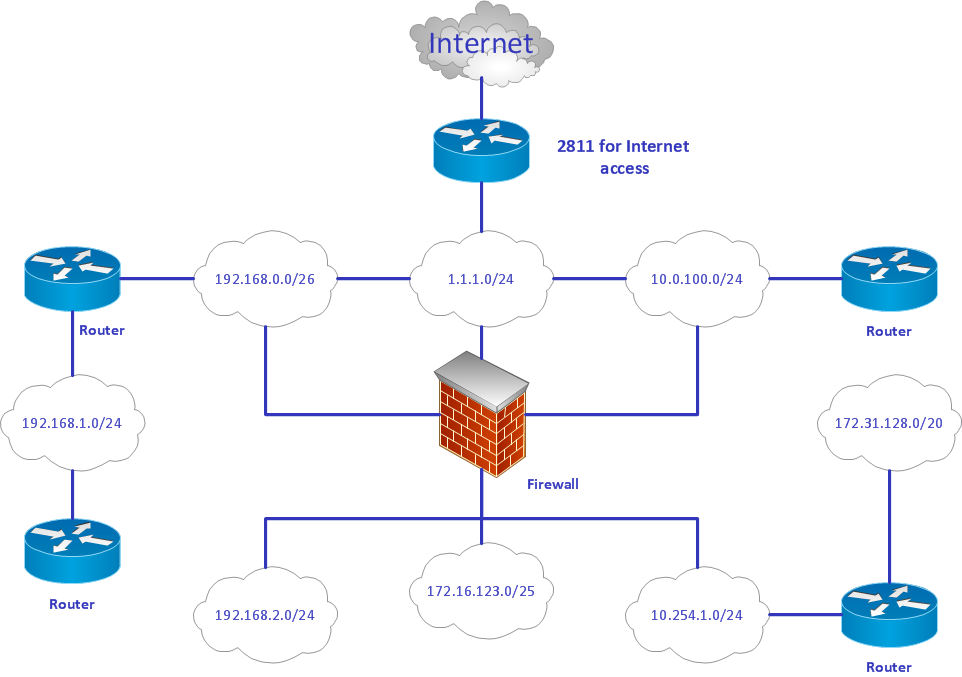
Data Flow Diagram

Produce Professional Diagrams More Quickly, Easily and Cost Effectively
Professional diagramming software for mac helps you create variety diagrams, graphics, charts, live dashboards and plenty of graphics and pictures for your business and study.
Flowchart Definition

Why Flowchart Important to Accounting Information System?

Flowcharts are used to represent accounting information in a system. There are special symbols which are used to create accounting flowcharts. Try conceptdraw flowcharting set of symbols to draw a professional charts.
Diagram Flow Chart

Definition Flowchart
This definition flowchart gives a clear answer for the question "What is a flowchart?". It is convenient to use a powerful ConceptDraw DIAGRAM software extended with Flowcharts Solution from the "Diagrams" Area of ConceptDraw Solution Park to design flowcharts of various types which will additionally illustrate a definition flowchart.
UML Diagram Visio

Using the 13 libraries of the Rapid UML Solution for ConceptDraw DIAGRAM you can create your own visual vector UML diagrams quick and easy.
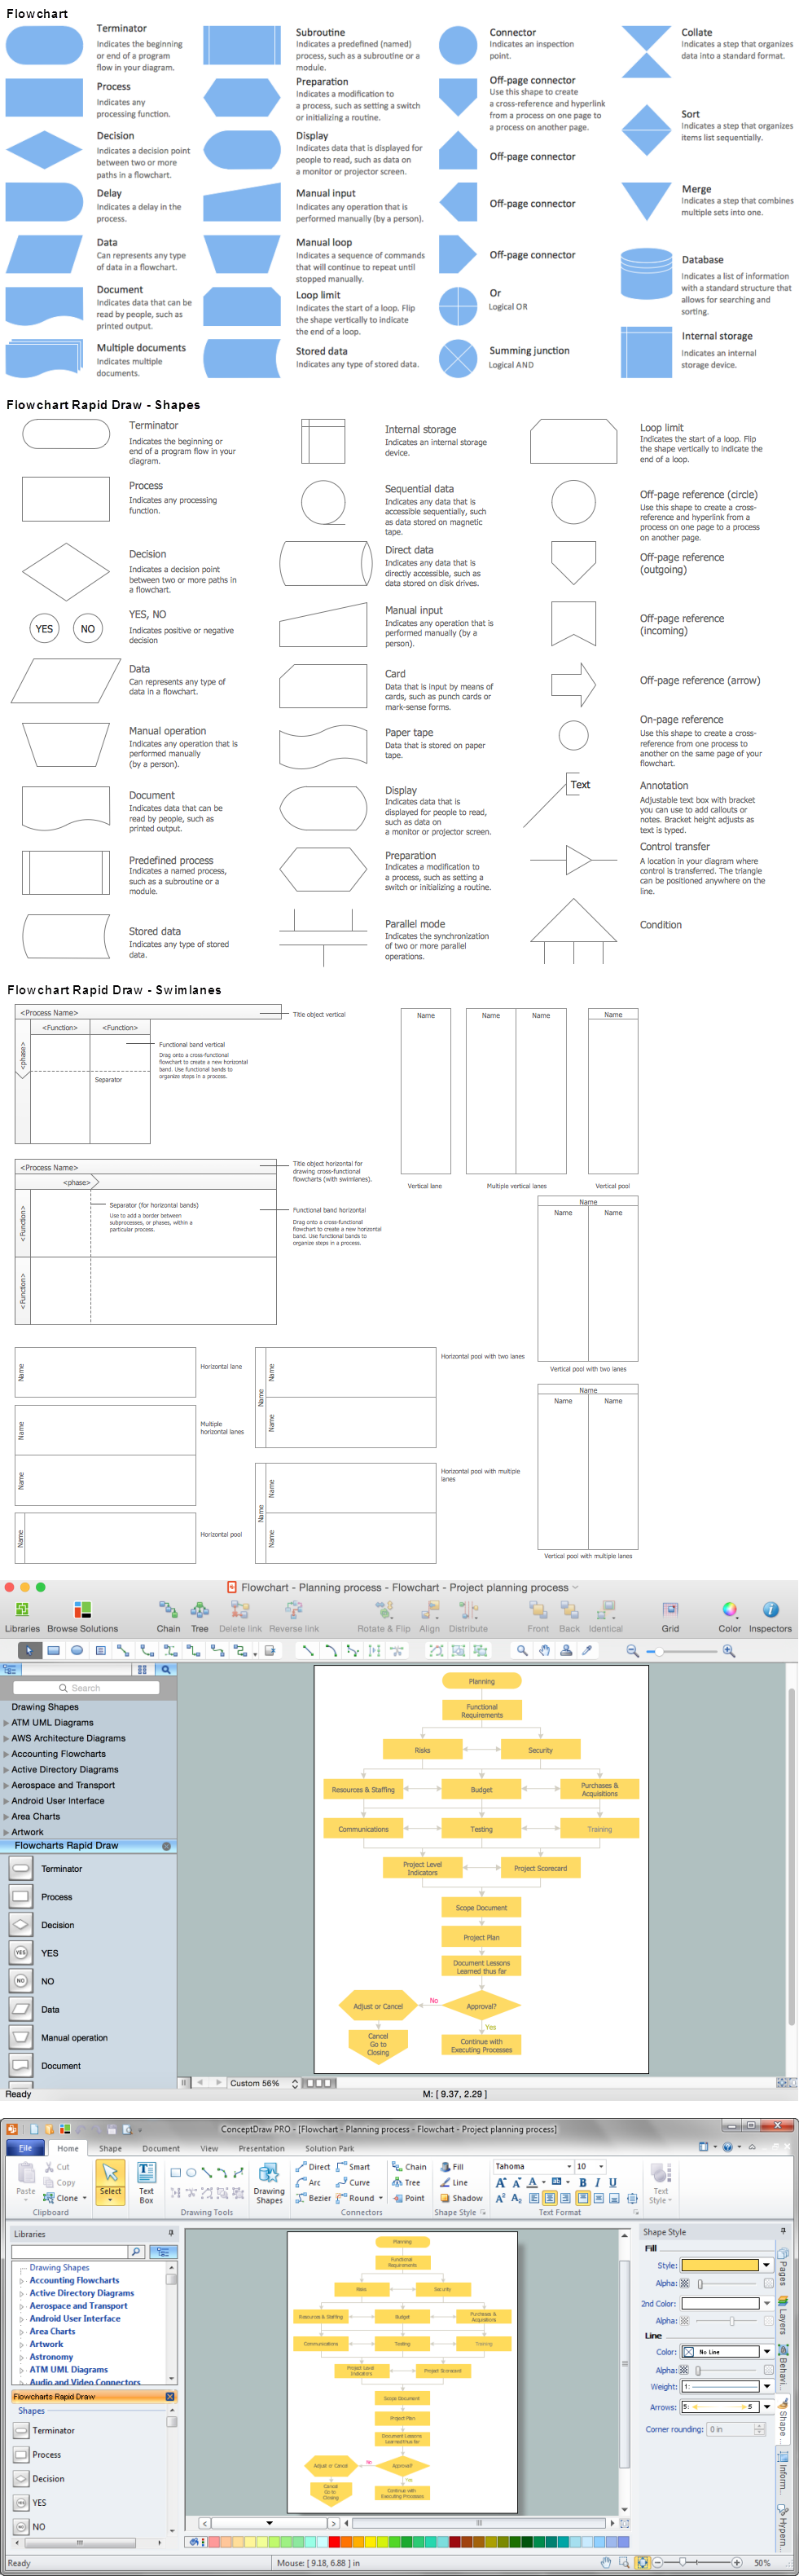
Flowchart design. Flowchart symbols, shapes, stencils and icons

Mavericks have always desired to stand apart and gorgeous design is the recipe for that. Any business graphic document will be more understandable if will use an expository color scheme for their parts. Flowchart design makes versatile presenting and explaining of the process and gives a fresh view that distinguishes it from black and white flowcharts on a paper. Workflow diagram or process flow diagrams become more understandable to ordinary people when it use minimum symbols and special signs.
The best design can be accomplished by starting from any of the suitable Conceptdraw examples. Pick one of them and begin to input proper text into each Flowchart symbols and shapes. Apply less colors in the document and don't turn into rainbow your diagram, three or four will be enough, also note that business process flowchart may not contain bright color hues. The next clue is to use identical colors for same flowchart shape types.

- Waterfall Flowchart
- ConceptDraw PRO DFD Software | Waterfall Model Dfd
- Waterfall Bar Chart | Process Flowchart | Chart Examples | Describe ...
- Steps of Accounting Cycle | Process Flowchart | Waterfall Bar Chart ...
- Pie Chart Software | Waterfall Bar Chart | Flow chart Example ...
- Waterfall Bar Chart | Export from ConceptDraw MINDMAP to ...
- Waterfall Bar Chart | Process Flowchart | Software Development ...
- Waterfall Bar Chart | Flow chart Example. Warehouse Flowchart ...
- Agile Methodology | SSADM Diagram | Basic Flowchart Symbols ...
- Waterfall Diagram Of Human Resources
- ERD | Entity Relationship Diagrams, ERD Software for Mac and Win
- Flowchart | Basic Flowchart Symbols and Meaning
- Flowchart | Flowchart Design - Symbols, Shapes, Stencils and Icons
- Flowchart | Flow Chart Symbols
- Electrical | Electrical Drawing - Wiring and Circuits Schematics
- Flowchart | Common Flowchart Symbols
- Flowchart | Common Flowchart Symbols