What is Value Stream Mapping?

Lean Manufacturing Diagrams

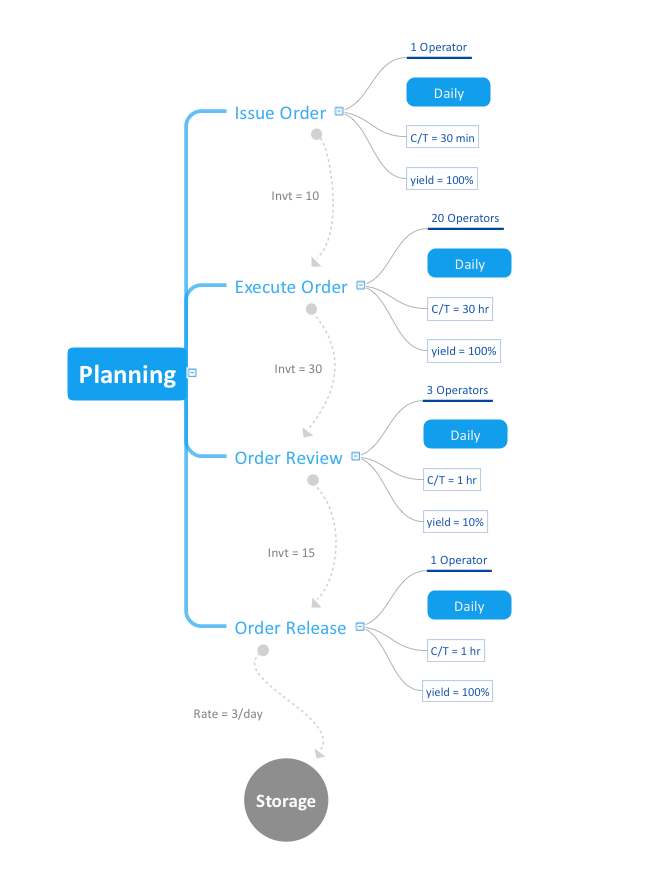
Value Stream Mapping Template
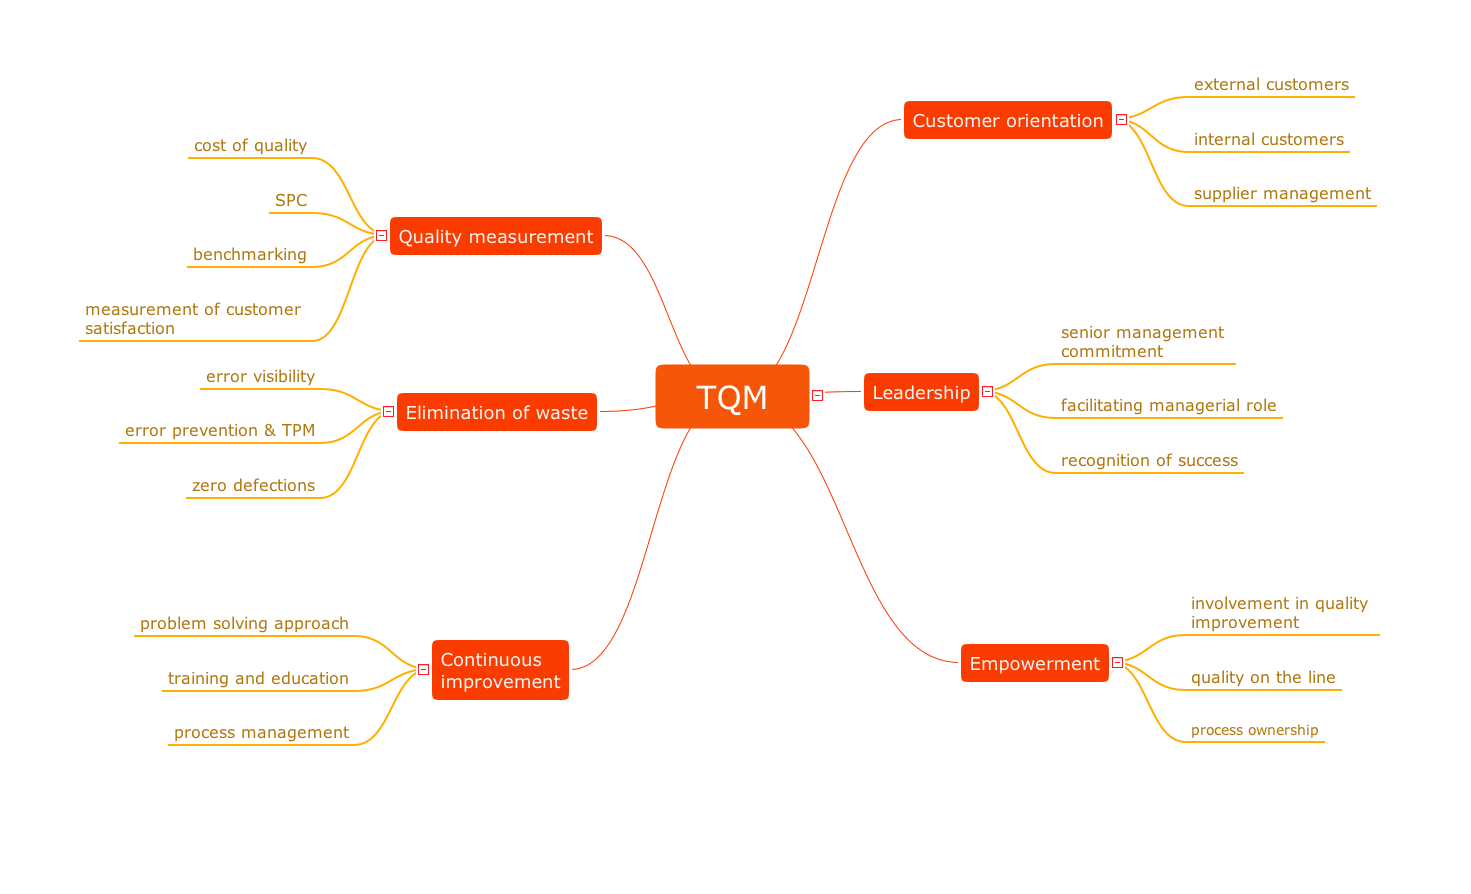
Cause and Effect Diagram

Total Quality Management Value

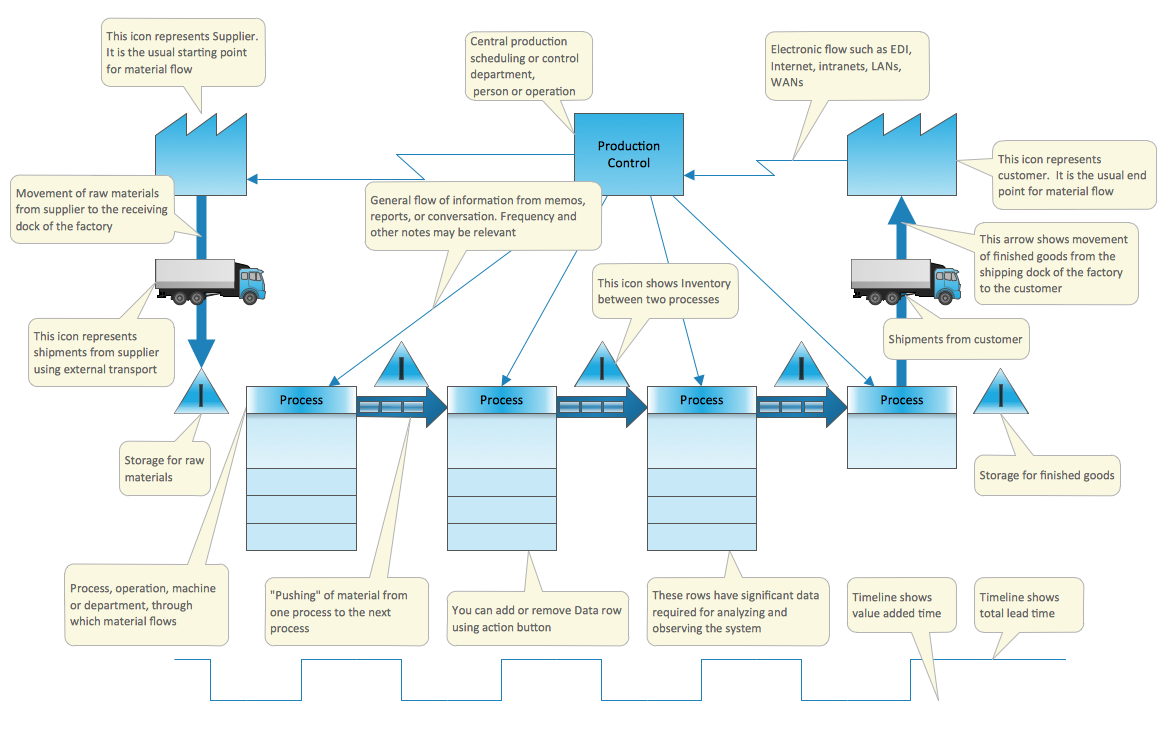
 Value Stream Mapping
Value stream mapping solution extends ConceptDraw DIAGRAM software with templates, samples and vector stencils for drawing the Value Stream Maps (VSM) in lean manufacturing practice.
Value Stream Analysis

Cause and Effect Analysis

Value Stream Mapping Symbols

Quality Mind Map Solution
Quality Control
Lean Six Sigma Diagram Software

ConceptDraw DIAGRAM Compatibility with MS Visio

Value Stream & Process Flow Diagramming Software

- Lean Manufacturing Diagrams | How Do Fishbone Diagrams Solve ...
- Value Stream Mapping | Fishbone Diagram | Software Development ...
- Vsm Fish Bone Diagram
- Fishbone Diagram | Value Stream Mapping | Cross-Functional ...
- Cafe and Restaurant Floor Plans | Fishbone Diagrams | Value ...
- Fishbone Diagrams | Process Flowchart | Value-Stream Mapping for ...
- Manufacturing 8 Ms fishbone diagram - Template | Value-Stream ...
- Fault Tree Analysis Diagrams | Value Stream Mapping | Fishbone ...
- How Do Fishbone Diagrams Solve Manufacturing Problems | Value ...
- Value Stream Mapping | Fishbone Diagram | Crystal Mapping | Swot ...
- Fishbone Diagrams | Logistics Flow Charts | Value Stream Mapping ...
- Process Flowchart | Fishbone Diagram | Value Stream Mapping ...
- Fishbone Diagram | Presentation Exchange | Entity-Relationship ...
- Quality Control | Value-Stream Mapping for Manufacturing | Best ...
- SWOT and TOWS Matrix Diagrams | Fishbone Diagram ...
- Total Quality Management Value | Fishbone Diagram | 4ms Of ...
- Lean Manufacturing Diagrams | Manufacturing 8 Ms fishbone ...
- Enterprise Architecture Diagrams | Manufacturing 8 Ms fishbone ...
- How Do Fishbone Diagrams Solve Manufacturing Problems ...
- Fishbone Diagram | Using Fishbone Diagrams for Problem Solving ...
- ERD | Entity Relationship Diagrams, ERD Software for Mac and Win
- Flowchart | Basic Flowchart Symbols and Meaning
- Flowchart | Flowchart Design - Symbols, Shapes, Stencils and Icons
- Flowchart | Flow Chart Symbols
- Electrical | Electrical Drawing - Wiring and Circuits Schematics
- Flowchart | Common Flowchart Symbols
- Flowchart | Common Flowchart Symbols