PROBLEM ANALYSIS. Root Cause Analysis Tree Diagram

ConceptDraw Office suite is a software for problem analysis.

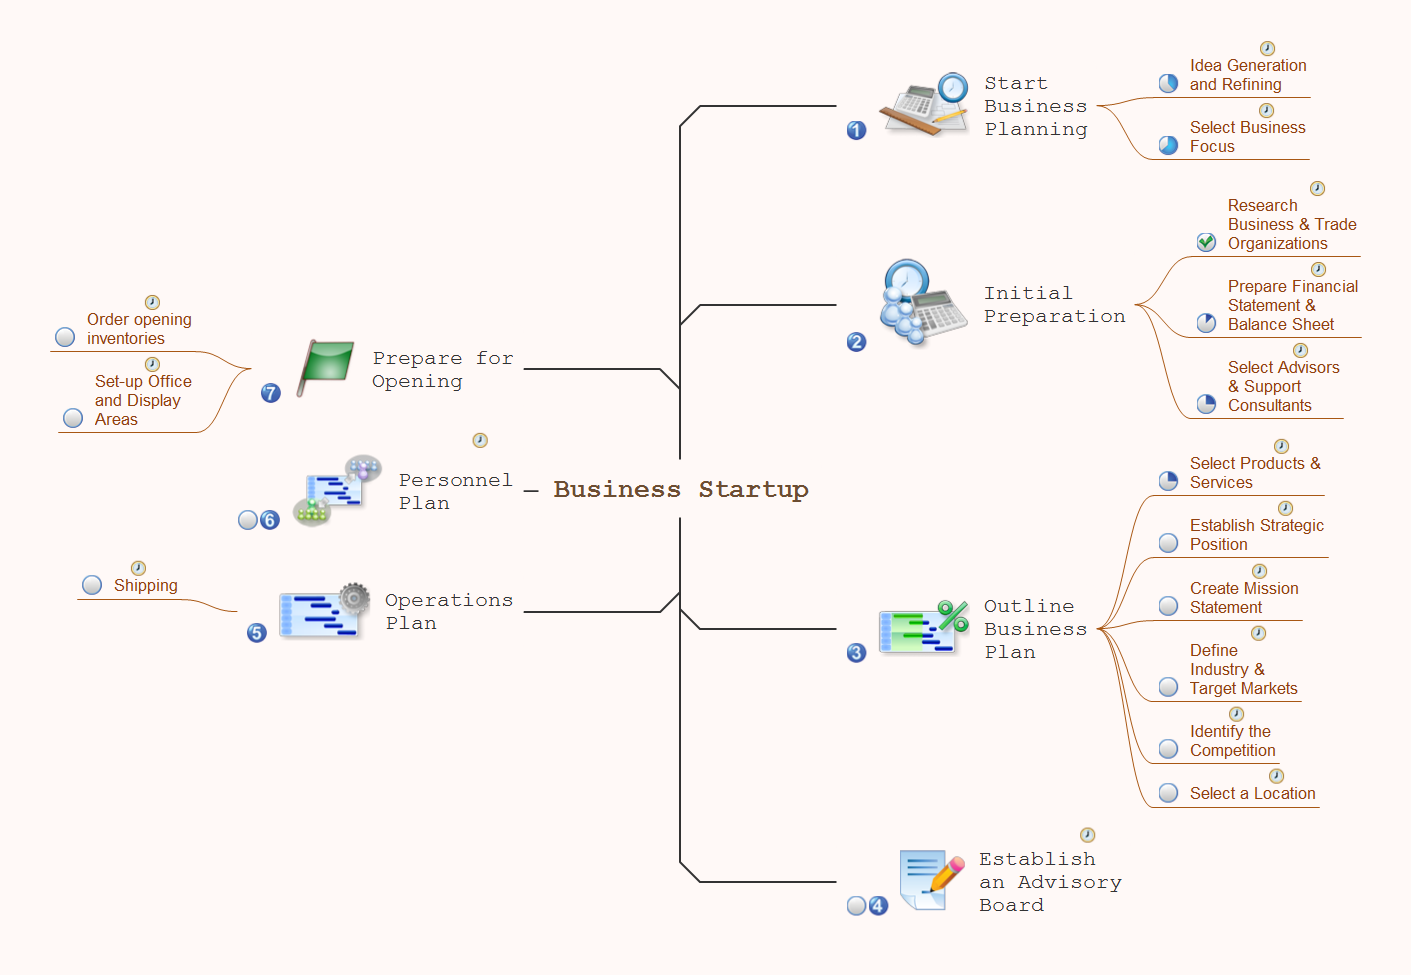
Visual Presentations Made Easy with Diagramming Software


Collaboration in a Project Team

Basic Diagramming


 ConceptDraw Solution Park
ConceptDraw Solution Park collects graphic extensions, examples and learning materials
Think. Act. Accomplish.

HelpDesk
How to Support Your Mind Map with Visual Elements

Communication Tool for Remote Project Management

Remote Presentation for Skype solution for ConceptDraw MINDMAP helps communicate with remote team and customers in visual manner on wide range of issues. Using this solution for regular status meetings allows you to push your team on tasks and keep task statuses up to date.
ConceptDraw DIAGRAM Compatibility with MS Visio

How To Use Skype for Business

Examples of Flowcharts, Org Charts and More


Decision Making

The Seven Management and Planning Tools is a set for such diagrams: Affinity Diagram, Relations Diagram, Prioritization Matrix, Root Cause Tree Diagram, Involvement Matrix, PERT Chart, Risk Diagram (PDPC).
 Business Infographics Area
ConceptDraw Business Infographics Solutions helps you to design eye-catching marketing infographics, on subjects such as content marketing, education, IT, social media marketing, and marketing plans; allowing you to represent, share and explain various pi
- Visual Management Tools
- Management | Quality Mind Map | Think. Act. Accomplish. | Mind ...
- How to make great presentation via Skype? ...how it works with ...
- How to Use Filters | Project Management Area | Schedule pie chart ...
- Bubble Ideas
- Quality visualization in your company | Quality Improvement | Think ...
- Block Diagram Of Line Organization Management
- Mind Map Making Software | One formula of professional mind ...
- The Mind Map Evernote Possibilities | Best Mind Mapping Program ...
- Seven Management and Planning Tools | PROBLEM ANALYSIS ...
- Line Organization With Block Diagram Management Since
- Diagram Software
- Decision Making Software For Small Business | How To Make the ...
- How to Add a Bubble Diagram to a PowerPoint Presentation Using ...
- Management | How to show a mind map presentation via Skype ...
- Employee distribution - HR dashboard | Frequency Distribution ...
- Quality Management Teams | Mind Mapping in the Quality ...
- Seven Management And Planning Tools Examples
- Pie Charts Represent Visual Business Structure
- How To Implement Collaborative Project Management ...
- ERD | Entity Relationship Diagrams, ERD Software for Mac and Win
- Flowchart | Basic Flowchart Symbols and Meaning
- Flowchart | Flowchart Design - Symbols, Shapes, Stencils and Icons
- Flowchart | Flow Chart Symbols
- Electrical | Electrical Drawing - Wiring and Circuits Schematics
- Flowchart | Common Flowchart Symbols
- Flowchart | Common Flowchart Symbols