Basic Flowchart Symbols and Meaning


Entity Relationship Diagram Symbols

ERD symbols used for professional ERD drawing are collected in libraries from the Entity-Relationship Diagram (ERD) solution for ConceptDraw DIAGRAM.
Processing Flow Chart

ConceptDraw DIAGRAM enhanced with Flowcharts Solution from the "Diagrams" Area of ConceptDraw Solution Park is a powerful Processing Flow Chart software which will help save lots of your time.
Data Flow Diagram Symbols. DFD Library

Process Flow Chart

ConceptDraw DIAGRAM diagramming and vector drawing software extended with Flowcharts Solution from the "Diagrams" Area of ConceptDraw Solution Park is the best way to create Process Flow Chart and other types of flowcharts.
Jacobson Use Cases Diagram

 Plan-Do-Check-Act (PDCA)
Plan-Do-Check-Act (PDCA) solution extends the ConceptDraw DIAGRAM software with collection of samples and predesigned vector objects for easy visualization four stages of PDCA cycle, PDSA cycle, or Deming cycle, for illustration effective application of this method to the practical business tasks, for depiction the implementation of changes and solution the problems in business processes. Plan-Do-Check-Act (PDCA) solution helps to design professional-looking and attractive Plan Do Study Act diagrams, PDCA cycle diagrams, PDCA Process diagrams, and to construct the Quality Management Process Models, which all assist to manage efficiently the business processes, to improve quality of work and to reduce significantly the costs.
Process Flow Diagram

ConceptDraw DIAGRAM diagramming and vector drawing software extended with powerful tools of Flowcharts Solution from the "Diagrams" Area of ConceptDraw Solution Park is effective for drawing: Process Flow Diagram, Flow Process Diagram, Business Process Flow Diagrams.
Network diagrams with ConceptDraw DIAGRAM

Network diagrams are divided into Physical Network Diagrams and Logical Network Diagrams.
Network diagram is an indispensable tool for network administrators and engineers at development of new networks and management of existing networks.
Fully Connected Network Topology Diagram
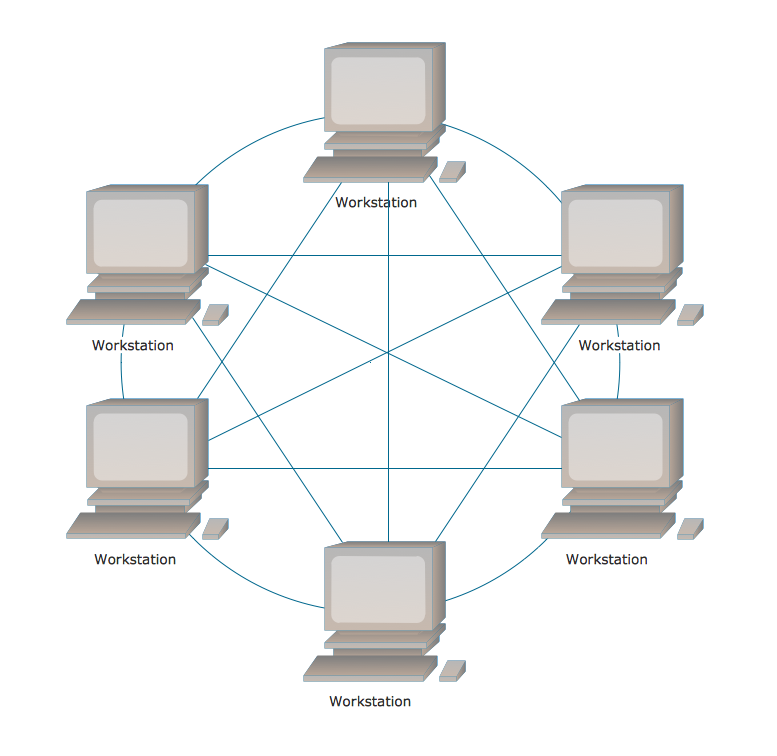
The Computer and Networks solution from Computer and Networks area of ConceptDraw Solution Park provides examples, templates and vector stencils library with symbols of local area network (LAN) and wireless LAN (WLAN) equipment.
- Flowchart Loop Visio
- Cubetto Flowchart | For Loop In Visio Flowchart
- Visio Loop Arrow
- Drawing Arrow Loop Diagram Visio
- Loop Shape Flowchart
- Symbol For Iteration Within Visio
- Cross Functional Flowchart Shapes | Flowchart Loop Limit Example
- Visio Loop
- Show Loop In Flow Diagram
- Fat Arrow Visio Clipart
- ERD | Entity Relationship Diagrams, ERD Software for Mac and Win
- Flowchart | Basic Flowchart Symbols and Meaning
- Flowchart | Flowchart Design - Symbols, Shapes, Stencils and Icons
- Flowchart | Flow Chart Symbols
- Electrical | Electrical Drawing - Wiring and Circuits Schematics
- Flowchart | Common Flowchart Symbols
- Flowchart | Common Flowchart Symbols