HelpDesk
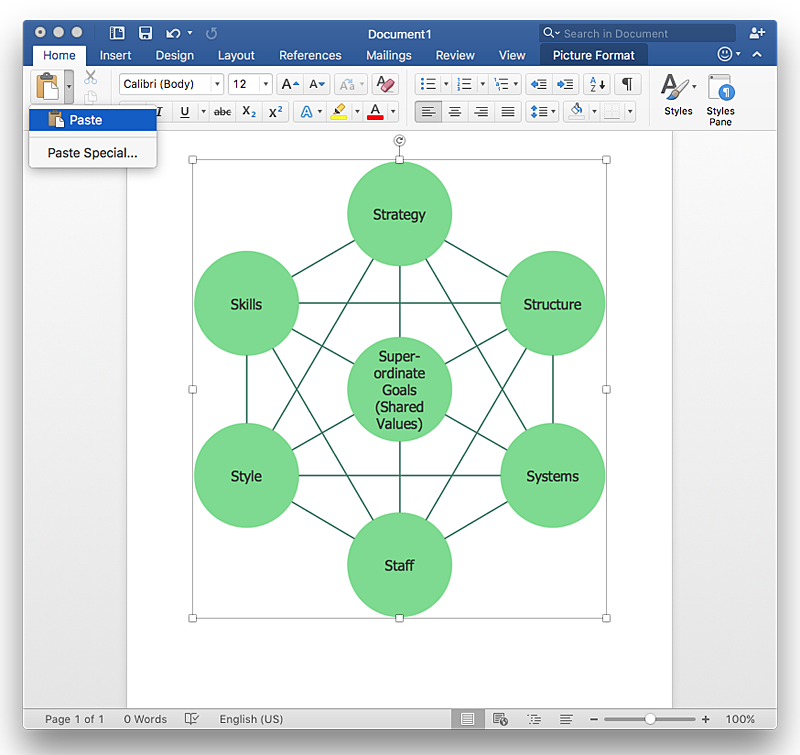
How to Add a Bubble Diagram to a MS Word Document Using ConceptDraw PRO
A bubble diagram is used the same purpose as a scatter diagram, but in the case, if the data has three dimensions, each of that containing the set of values. A bubble chart is a diagram in which the data points are replaced with bubbles, and the size of the bubbles represents some additional dimension of the data. A bubble chart does not have the axis. The sizes of the bubbles are determined by the values in the third dimension. Any additional information about the entities beyond their three primary dimensions can be depicted by rendering bubbles in colors and patterns that are selected in a certain way. The legend containing the further information can be added to a bubble diagram. ConceptDraw PRO allows you to easily create various business management and marketing charts, including bubble diagrams and then add them to a MS Word document.HelpDesk
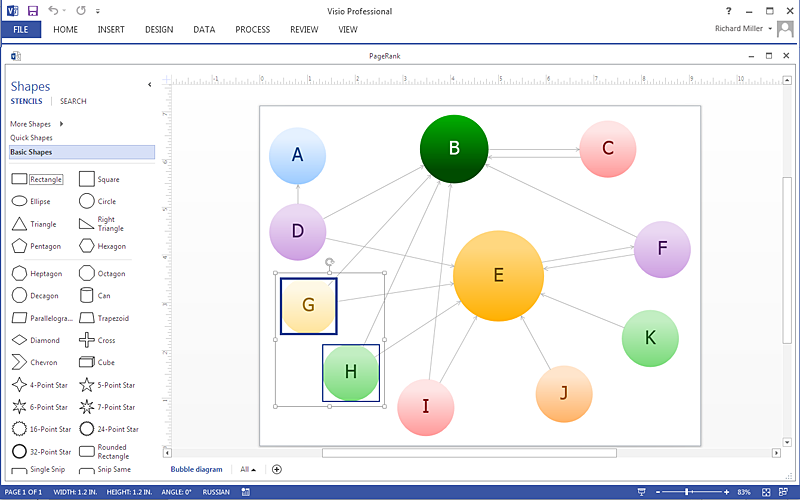
How To Create a Visio Bubble Chart Using ConceptDraw PRO
ConceptDraw PRO allows you to easily create business charts and diagrams of any complexity, including the bubbles diagram and then make a MS Visio file from your diagram in a few simple steps.Vertical Cross Functional Flowchart
ConceptDraw PRO is a powerful tool that helps you create professional looking cross-functional flowcharts with the well-designed objects. ConceptDraw PRO - Drawing Software for Vertical Cross Functional Flowchart. ConceptDraw allows you to focus on work, not the drawing process. ConceptDraw Arrows10 Technology allows to draw connectors with smart behavior that gives flexibility to you during work process.- Bubble Chart | How To Make a Bubble Chart | How to Draw a ...
- Video How To Draw A Bubble Chart
- Bubble Chart | Bubble Charts | How to Draw a Bubble Chart | Bubble ...
- Bubble diagrams with ConceptDraw PRO | How to Draw a Bubble ...
- Bubble Chart Maker | How To Create a Bubble Chart | Bubble ...
- Bubble Chart Examples
- Audio and Video Connectors | How to Draw a Bubble Chart | Activity ...
- How To Create a Bubble Chart | How to Draw a Bubble Chart ...
- How To Create a Bubble Chart | Four Dimensions Bubble Plot ...
- How To Make a Bubble Chart | Bubble diagrams with ConceptDraw ...
- ERD | Entity Relationship Diagrams, ERD Software for Mac and Win
- Flowchart | Basic Flowchart Symbols and Meaning
- Flowchart | Flowchart Design - Symbols, Shapes, Stencils and Icons
- Flowchart | Flow Chart Symbols
- Electrical | Electrical Drawing - Wiring and Circuits Schematics
- Flowchart | Common Flowchart Symbols
- Flowchart | Common Flowchart Symbols


