Venn Diagram Template for Word

Venn Diagram Maker

Line Chart Template for Word

This sample shows the Line Chart of annual percentage change. The Line Chart allows you to clearly see the changes of data over the time.
Bar Chart Template for Word

You can quickly rework these bar graph templates into your own charts by simply changing displayed data, title and legend texts.
Venn Diagram Examples for Problem Solving. Venn Diagram as a Truth Table

Venn Diagram

Venn Diagram Template

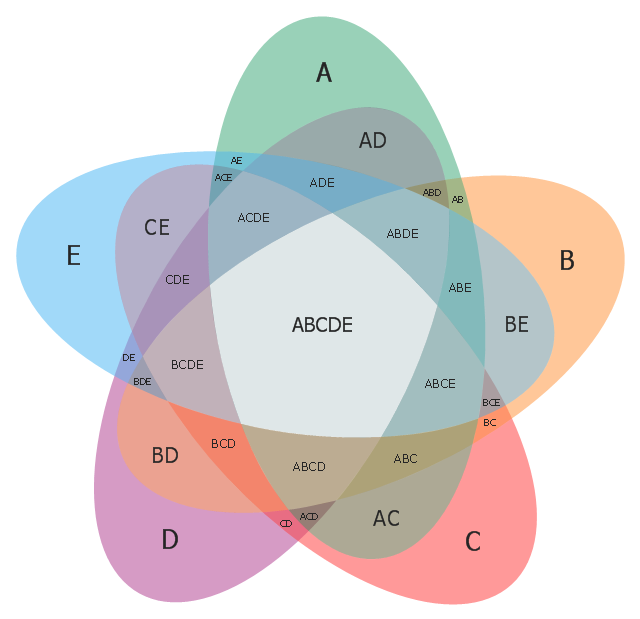
Use this template to design your five set Venn diagrams.
"Five-set Venn diagram using congruent ellipses in a radially symmetrical arrangement devised by Branko Grünbaum. Labels have been simplified for greater readability." [Venn diagram. Wikipedia]
The template "5-set Venn diagram" for the ConceptDraw PRO diagramming and vector drawing software is included in the Venn Diagrams solution from the area "What is a Diagram" of ConceptDraw Solution Park.
Template
3 Circle Venn Diagram. Venn Diagram Example

Venn Diagrams visualize all possible logical intersections between several sets and are widely used in mathematics, logic, statistics, marketing, sociology, etc.
Use this template to design your four set Venn diagrams.
In maths logic Venn diagram is "a diagram in which mathematical sets or terms of a categorial statement are represented by overlapping circles within a boundary representing the universal set, so that all possible combinations of the relevant properties are represented by the various distinct areas in the diagram". [thefreedictionary.com/ Venn+diagram]
The template "4-set Venn diagram" for the ConceptDraw PRO diagramming and vector drawing software is included in the Venn Diagrams solution from the area "What is a Diagram" of ConceptDraw Solution Park.
Template

3 Circle Venn. Venn Diagram Example

 Venn Diagrams
Venn Diagrams are actively used to illustrate simple set relationships in set theory and probability theory, logic and statistics, mathematics and computer science, linguistics, sociology, and marketing. Venn Diagrams are also often used to visually summarize the status and future viability of a project.
Multi Layer Venn Diagram. Venn Diagram Example

Use this triangular Venn diagram template to create your own marketing pyramid diagrams using the ConceptDraw PRO diagramming and vector drawing software.
The triangular Venn diagram template is included in the Pyramid Diagrams solution from the Marketing area of ConceptDraw Solution Park.
www.conceptdraw.com/ solution-park/ marketing-pyramid-diagrams
The triangular Venn diagram template is included in the Pyramid Diagrams solution from the Marketing area of ConceptDraw Solution Park.
www.conceptdraw.com/ solution-park/ marketing-pyramid-diagrams
Triangular Venn diagram

HelpDesk
How to Add a Block Diagram to a MS Word ™ Document Using ConceptDraw PRO

- Venn Diagram Template for Word
- Venn Diagram Template for Word | How to Add a Block Diagram to a ...
- Basketball Court Dimensions | Venn Diagram Template for Word ...
- Venn Diagram Template for Word | Logic gate diagram - Template ...
- Venn Diagram Template for Word | SWOT Matrix Template | Onion ...
- Bar Chart Template for Word | Venn Diagram Template for Word ...
- Venn Diagram Template for Word | Line Chart Template for Word ...
- 5-Set Venn diagram - Template | Venn Diagram Template for Word ...
- Venn Diagram | Venn Diagram Template for Word | 3 Circle Venn ...
- 25 Typical Orgcharts | Venn Diagram Template for Word ...
- Venn Diagram Template for Word | Circle Spoke Diagram Template ...
- Venn Diagrams | Venn Diagram Template for Word | Venn Diagram ...
- Venn Diagram Maker | Venn Diagrams | Venn Diagram Template for ...
- Venn Diagram | Venn Diagram Template for Word | Basic Circles ...
- Venn Diagram Template for Word | Venn Diagrams | Venn Diagram ...
- Venn Diagram Template for Word | Business process swim lane ...
- 5-Set Venn diagram - Template | Venn Diagram Template for Word ...
- Venn Diagram Template for Word | Venn Diagram | 3 Circle Venn ...
- 4-Set Venn diagram - Template | Venn Diagram Template for Word ...
- Venn Diagram | Venn Diagram Template for Word | 2-Set Venn ...
- ERD | Entity Relationship Diagrams, ERD Software for Mac and Win
- Flowchart | Basic Flowchart Symbols and Meaning
- Flowchart | Flowchart Design - Symbols, Shapes, Stencils and Icons
- Flowchart | Flow Chart Symbols
- Electrical | Electrical Drawing - Wiring and Circuits Schematics
- Flowchart | Common Flowchart Symbols
- Flowchart | Common Flowchart Symbols