Venn Diagram Template for Word

3 Circle Venn Diagram. Venn Diagram Example

Venn Diagrams visualize all possible logical intersections between several sets and are widely used in mathematics, logic, statistics, marketing, sociology, etc.
3 Circle Venn. Venn Diagram Example

Management Tools — Total Quality Management

Venn Diagram Examples for Problem Solving. Venn Diagram as a Truth Table

Scientific Symbols Chart

Mathematics Solution from the Science and Education area of ConceptDraw Solution Park includes a few shape libraries of plane, solid geometric figures, trigonometrical functions and greek letters to help you create different professional looking mathematic illustrations for science and education.
Express-G Diagram

Venn Diagrams

ConceptDraw PRO diagramming and vector drawing software extended with Venn Diagrams solution from "What is a Diagram" area offers set of useful drawing tools for easy creating the Venn Diagrams for any quantity of sets.
Mathematical Diagrams

Mathematics solution provides 3 libraries: Plane Geometry Library, Solid Geometry Library, Trigonometric Functions Library.
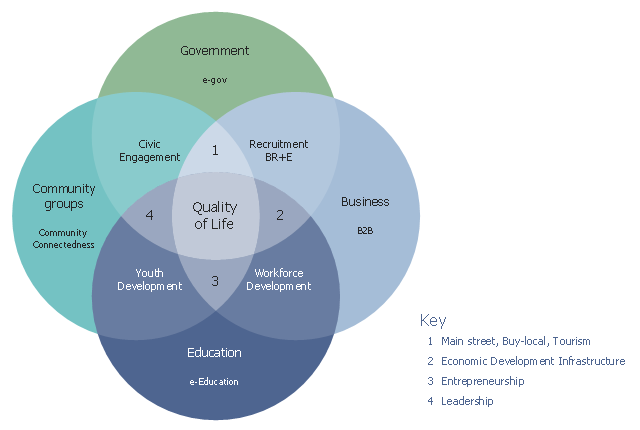
This Venn diagram sample shows how community elements overlap. It was designed on the base of the figure 1 in the course "eStrategies for Local Governments" from the website of the Southern Rural Development Center (SRDC), the Mississippi State University.
"Ultimately, the goal of this curriculum is to position a community for success as they develop web-based strategies for community and economic development. In support of this goal, the authors use a conceptual model that incorporates four fundamental elements (applications) of a community: government, business, education and community groups (Figure 1). Using the Venn diagram, it shows that each of these elements overlap with another, finally culminating in “Quality of Life” where all four overlap." [srdc.msstate.edu/ ecommerce/ curricula/ egovernment/ overview.html]
The Venn diagram example "Community elements overlapping" was created using the ConceptDraw PRO diagramming and vector drawing software extended with the Venn Diagrams solution from the area "What is a Diagram" of ConceptDraw Solution Park.
Venn diagram
Bar Diagrams for Problem Solving. Create space science bar charts with Bar Graphs Solution

Create bar graphs for visual solving your scientific problems and data comparison using the ConceptDraw PRO diagramming and vector drawing software extended with the Bar Graphs Solution from the Graphs and Charts area of ConceptDraw Solition Park.
Physics Diagrams

How To use House Plan Software


 Mathematics
Mathematics solution extends ConceptDraw PRO software with templates, samples and libraries of vector stencils for drawing the mathematical illustrations, diagrams and charts.
- Venn Diagram Template | 3 Circle Venn Diagram . Venn Diagram ...
- How to Create a Venn Diagram in ConceptDraw PRO | Venn ...
- Circles Venn Diagram
- Venn Diagram Maker | Venn Diagram | Venn Diagram Examples for ...
- Venn Diagrams | Venn Diagram Examples for Problem Solving ...
- Venn Diagrams | Venn Diagram Examples for Problem Solving ...
- How to Create a Venn Diagram in ConceptDraw PRO | Multi Layer ...
- Venn Diagram Maker | Venn Diagram Examples for Problem Solving ...
- Plane Figures Drawing Examples Solution
- Venn Diagrams | Venn Diagram Maker | Venn Diagram Template for ...
- 5-Set Venn diagram - Template
- 3 Circle Venn Diagram Problems And Solutions
- 4-Set Venn diagram - Template | Venn Diagrams | Cylinder Venn ...
- Venn Diagram With Easy Concepts
- Diagram Questions On Plane Figures
- Concept Maps | Basic Diagramming | Venn Diagrams | Concept ...
- Illustration Of Venn Diagram
- Printable Venn Diagram With 2 Circles
- 5 Set Venn Diagram Generator
- Venn Diagram Examples for Problem Solving . Venn Diagram as a ...
- ERD | Entity Relationship Diagrams, ERD Software for Mac and Win
- Flowchart | Basic Flowchart Symbols and Meaning
- Flowchart | Flowchart Design - Symbols, Shapes, Stencils and Icons
- Flowchart | Flow Chart Symbols
- Electrical | Electrical Drawing - Wiring and Circuits Schematics
- Flowchart | Common Flowchart Symbols
- Flowchart | Common Flowchart Symbols