3 Circle Venn Diagram. Venn Diagram Example

Venn Diagrams visualize all possible logical intersections between several sets and are widely used in mathematics, logic, statistics, marketing, sociology, etc.
3 Circle Venn. Venn Diagram Example

Venn Diagram Examples for Problem Solving. Venn Diagram as a Truth Table

Circles Venn Diagram

Cylinder Venn Diagram

What Is a Circle Spoke Diagram

Venn Diagram

2 Circle Venn Diagram. Venn Diagram Example

Circle Spoke Diagram Template

Interactive Venn Diagram
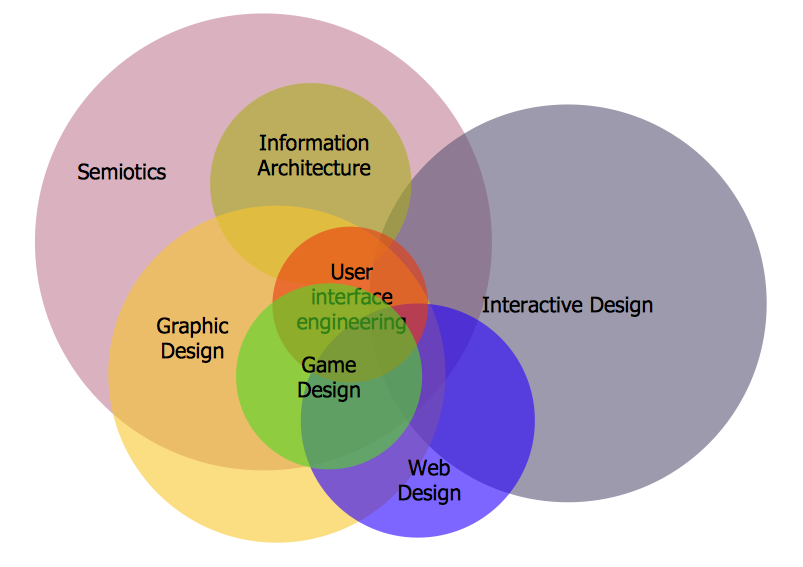
Venn Diagrams designed in ConceptDraw DIAGRAM are visual, bright, colorful, so they can be successfully used in different reports, appearances on the conferences, meetings.
Circular Diagram

The vector stencils library "Circular diagrams" contains 42 templates of circular diagrams: circular arrow diagram, circular motion diagram, arrow ring chart, doughnut chart (donut chart), circle pie chart, diamond pie chart, circle diagram, pie chart, ring chart, loop diagram, block loop diagram, arrow loop circle, crystal diagram, triangular diagram, diamond diagram, pentagon diagram, hexagon diagram, heptagon diagram, cycle diagram (cycle chart), stacked Venn diagram (onion diagram), arrow circle diagram.
Use these shapes to illustrate your marketing and sales documents, presentations, webpages and infographics in the ConceptDraw PRO diagramming and vector drawing software extended with the Target and Circular Diagrams solution from the Marketing area of ConceptDraw Solution Park.
www.conceptdraw.com/ solution-park/ marketing-target-and-circular-diagrams
Circular arrow diagram 1
Circular arrow diagram 2
Arrow ring chart
Doughnut chart

Diamond pie chart

Pie chart

Circle diagram

Circle pie chart 2

Circle pie chart 1

Ring chart 1 - 3 elements

Ring chart 1 - 4 elements

Ring chart 1 - 5 elements

Ring chart 1 - 6 elements

Ring chart 1 - 7 elements

Ring chart 2 - 3 elements

Ring chart 2 - 4 elements

Ring chart 2 - 5 elements

Ring chart 2 - 6 elements

Ring chart 2 - 7 elements

Crystal diagram - 3 elements

Crystal diagram - 4 elements

Crystal diagram - 5 elements

Crystal diagram - 6 elements

Crystal diagram - 7 elements

Stacked Venn diagram - 4

Stacked Venn diagram - 5

Stacked Venn diagram - 6

Stacked Venn diagram - 7

Basic loop diagram

Block loop diagram

Arrow loop circle
Arrow loop - 3 circles
Arrow loop - 4 circles
Arrow loop - 5 circles
Arrow loop - 6 circles
Arrow loop - 7 circles
Arrow circle diagram - 3
Arrow circle diagram - 4
Stacked Venn diagram - 3

Arrow circle diagram - 5
Arrow circle diagram - 6
Arrow circle diagram - 7
 Venn Diagrams
Venn Diagrams are actively used to illustrate simple set relationships in set theory and probability theory, logic and statistics, mathematics and computer science, linguistics, sociology, and marketing. Venn Diagrams are also often used to visually summarize the status and future viability of a project.
Best Tool for Infographic Construction

SWOT Analysis Tool for Small Business

- 3 Circle Venn Diagram Problems And Solutions
- Venn Diagram Maker 3 Circles
- 2 Circle Venn Diagram . Venn Diagram Example | 3 Circle Venn ...
- 3 Circle Venn Diagram . Venn Diagram Example | Venn diagrams ...
- 3 Circle Venn Diagram . Venn Diagram Example
- Venn Diagram In 3 Circles Solution
- 3 Circle Venn Diagram . Venn Diagram Example
- Venn Diagram | 3 Circle Venn Diagram . Venn Diagram Example ...
- 3 Circle Venn Diagram . Venn Diagram Example | Circular diagrams ...
- Circle Spoke Diagram Template | 3 Circle Venn Diagram . Venn ...
- Venn Diagram Examples 3 Circles
- Venn Diagram Solver 3 Circles
- 3 Circle Venn. Venn Diagram Example
- 3 Circle Venn Diagram Problem Solving With Solution
- Online Venn Diagram Maker 3 Circles
- Venn Diagram Template | 3 Circle Venn Diagram . Venn Diagram ...
- 3 Circle Venn Diagram . Venn Diagram Example | 2 Circle Venn ...
- 3 Circle Venn Diagram . Venn Diagram Example | Venn Diagrams ...
- Venn Diagram Creator 3 Circles
- Venn Diagram Maker | 3 Circle Venn. Venn Diagram Example | 3 ...
- ERD | Entity Relationship Diagrams, ERD Software for Mac and Win
- Flowchart | Basic Flowchart Symbols and Meaning
- Flowchart | Flowchart Design - Symbols, Shapes, Stencils and Icons
- Flowchart | Flow Chart Symbols
- Electrical | Electrical Drawing - Wiring and Circuits Schematics
- Flowchart | Common Flowchart Symbols
- Flowchart | Common Flowchart Symbols