Venn Diagram

Venn Diagram Maker

Venn Diagram Examples for Problem Solving. Environmental Social Science. Human Sustainability Confluence

Create your Venn diagrams for problem solving in environmental social science using the ConceptDraw PRO diagramming and vector drawing software extended with the Venn Diagrams solution from the area "Diagrams" of ConceptDraw Solution Park.
Multi Layer Venn Diagram. Venn Diagram Example

Venn Diagrams

ConceptDraw PRO diagramming and vector drawing software extended with Venn Diagrams solution from "Diagrams" area offers set of useful drawing tools for easy creating the Venn Diagrams for any quantity of sets.
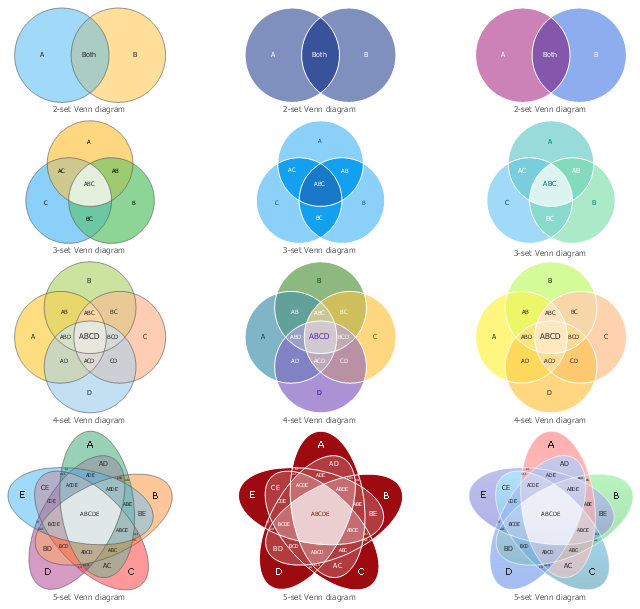
The vector stencils library "Venn diagrams" contains 12 templates. Use it for drawing Venn and Euler diagrams.
"A Venn diagram (also called a set diagram or logic diagram) is a diagram that shows all possible logical relations between a finite collection of different sets. Typically overlapping shapes, usually circles, are used, and an area-proportional or scaled Venn diagram is one in which the area of the shape is proportional to the number of elements it contains. These diagrams represent elements as points in the plane, and sets as regions inside curves. An element is in a set S just in case the corresponding point is in the region for S. They are thus a special case of Euler diagrams, which do not necessarily show all relations. Venn diagrams were conceived around 1880 by John Venn. They are used to teach elementary set theory, as well as illustrate simple set relationships in probability, logic, statistics, linguistics and computer science." [Venn diagram. Wikipedia]
The templates example "Design elements - Venn diagrams" was created using the ConceptDraw PRO diagramming and vector drawing software extended with the Venn Diagrams solution from the area "What is a Diagram" of ConceptDraw Solution Park.
Venn diagram templates
New Connectors Technology

ConceptDraw new connectors called Arrows10 Technology is more than enough versatility to draw any type of diagram with any degree of complexity.
ConceptDraw is the business diagram software of choice for business professionals who need to quickly and easily visualize, explore, and communicate information.
Circle Spoke Diagram Template

Venn Diagram Examples for Problem Solving. Computer Science. Chomsky Hierarchy

The Venn diagram example below visualizes the the class of language inclusions described by the Chomsky hierarchy.
Marketing Infographics

Simple Diagramming


Basic Flowchart Symbols and Meaning


Simple Flow Chart

- Venn Diagrams | Venn Diagram | How to Create a Venn Diagram in ...
- Venn Diagram Examples for Problem Solving. Computer Science ...
- Venn Diagram | Venn Diagram Template | 5- Set Venn diagram ...
- 5- Set Venn diagram - Template | Health Food | Marketing Diagrams ...
- How to Create a Venn Diagram in ConceptDraw PRO | Venn ...
- Venn Diagram Maker | Venn Diagram Template for Word | 4- Set ...
- Venn Diagram Examples for Problem Solving . Quantum Information ...
- Venn Diagram | Venn Diagram Template for Word | 2- Set Venn ...
- Cylinder Venn Diagram | Venn Diagram Examples for Problem ...
- Venn Diagram Examples for Problem Solving. Venn Diagram as a ...
- Venn diagrams - Vector stencils library | 2- Set Venn diagram ...
- Venn Diagram | 3 Circle Venn Diagram . Venn Diagram Example ...
- Venn Diagrams | Venn Diagram Examples for Problem Solving ...
- Venn Diagram | Venn Diagram Template for Word | Basic Circles ...
- Solving Venn Diagrams With 2 Circles
- Sets And Venn Diagrams
- Venn Diagram | Venn Diagram Examples for Problem Solving ...
- Different Designs Of Venn Diagram
- 2- Set Venn diagram - Template | Venn Diagram Examples for ...
- Venn Diagrams Solution
- ERD | Entity Relationship Diagrams, ERD Software for Mac and Win
- Flowchart | Basic Flowchart Symbols and Meaning
- Flowchart | Flowchart Design - Symbols, Shapes, Stencils and Icons
- Flowchart | Flow Chart Symbols
- Electrical | Electrical Drawing - Wiring and Circuits Schematics
- Flowchart | Common Flowchart Symbols
- Flowchart | Common Flowchart Symbols