Use this template to design your four set Venn diagrams.
In maths logic Venn diagram is "a diagram in which mathematical sets or terms of a categorial statement are represented by overlapping circles within a boundary representing the universal set, so that all possible combinations of the relevant properties are represented by the various distinct areas in the diagram". [thefreedictionary.com/ Venn+diagram]
The template "4-set Venn diagram" for the ConceptDraw PRO diagramming and vector drawing software is included in the Venn Diagrams solution from the area "What is a Diagram" of ConceptDraw Solution Park.
Template

Circles Venn Diagram

Venn Diagram Template for Word

3 Circle Venn. Venn Diagram Example

Basic Circles Venn Diagram. Venn Diagram Example

This Venn Diagram shows the relative complement of the set A with respect to the set B. It is the set of the elements in B, but not in A. In other words it is the set-theoretic difference B-A.
UML Class Diagram Constructor
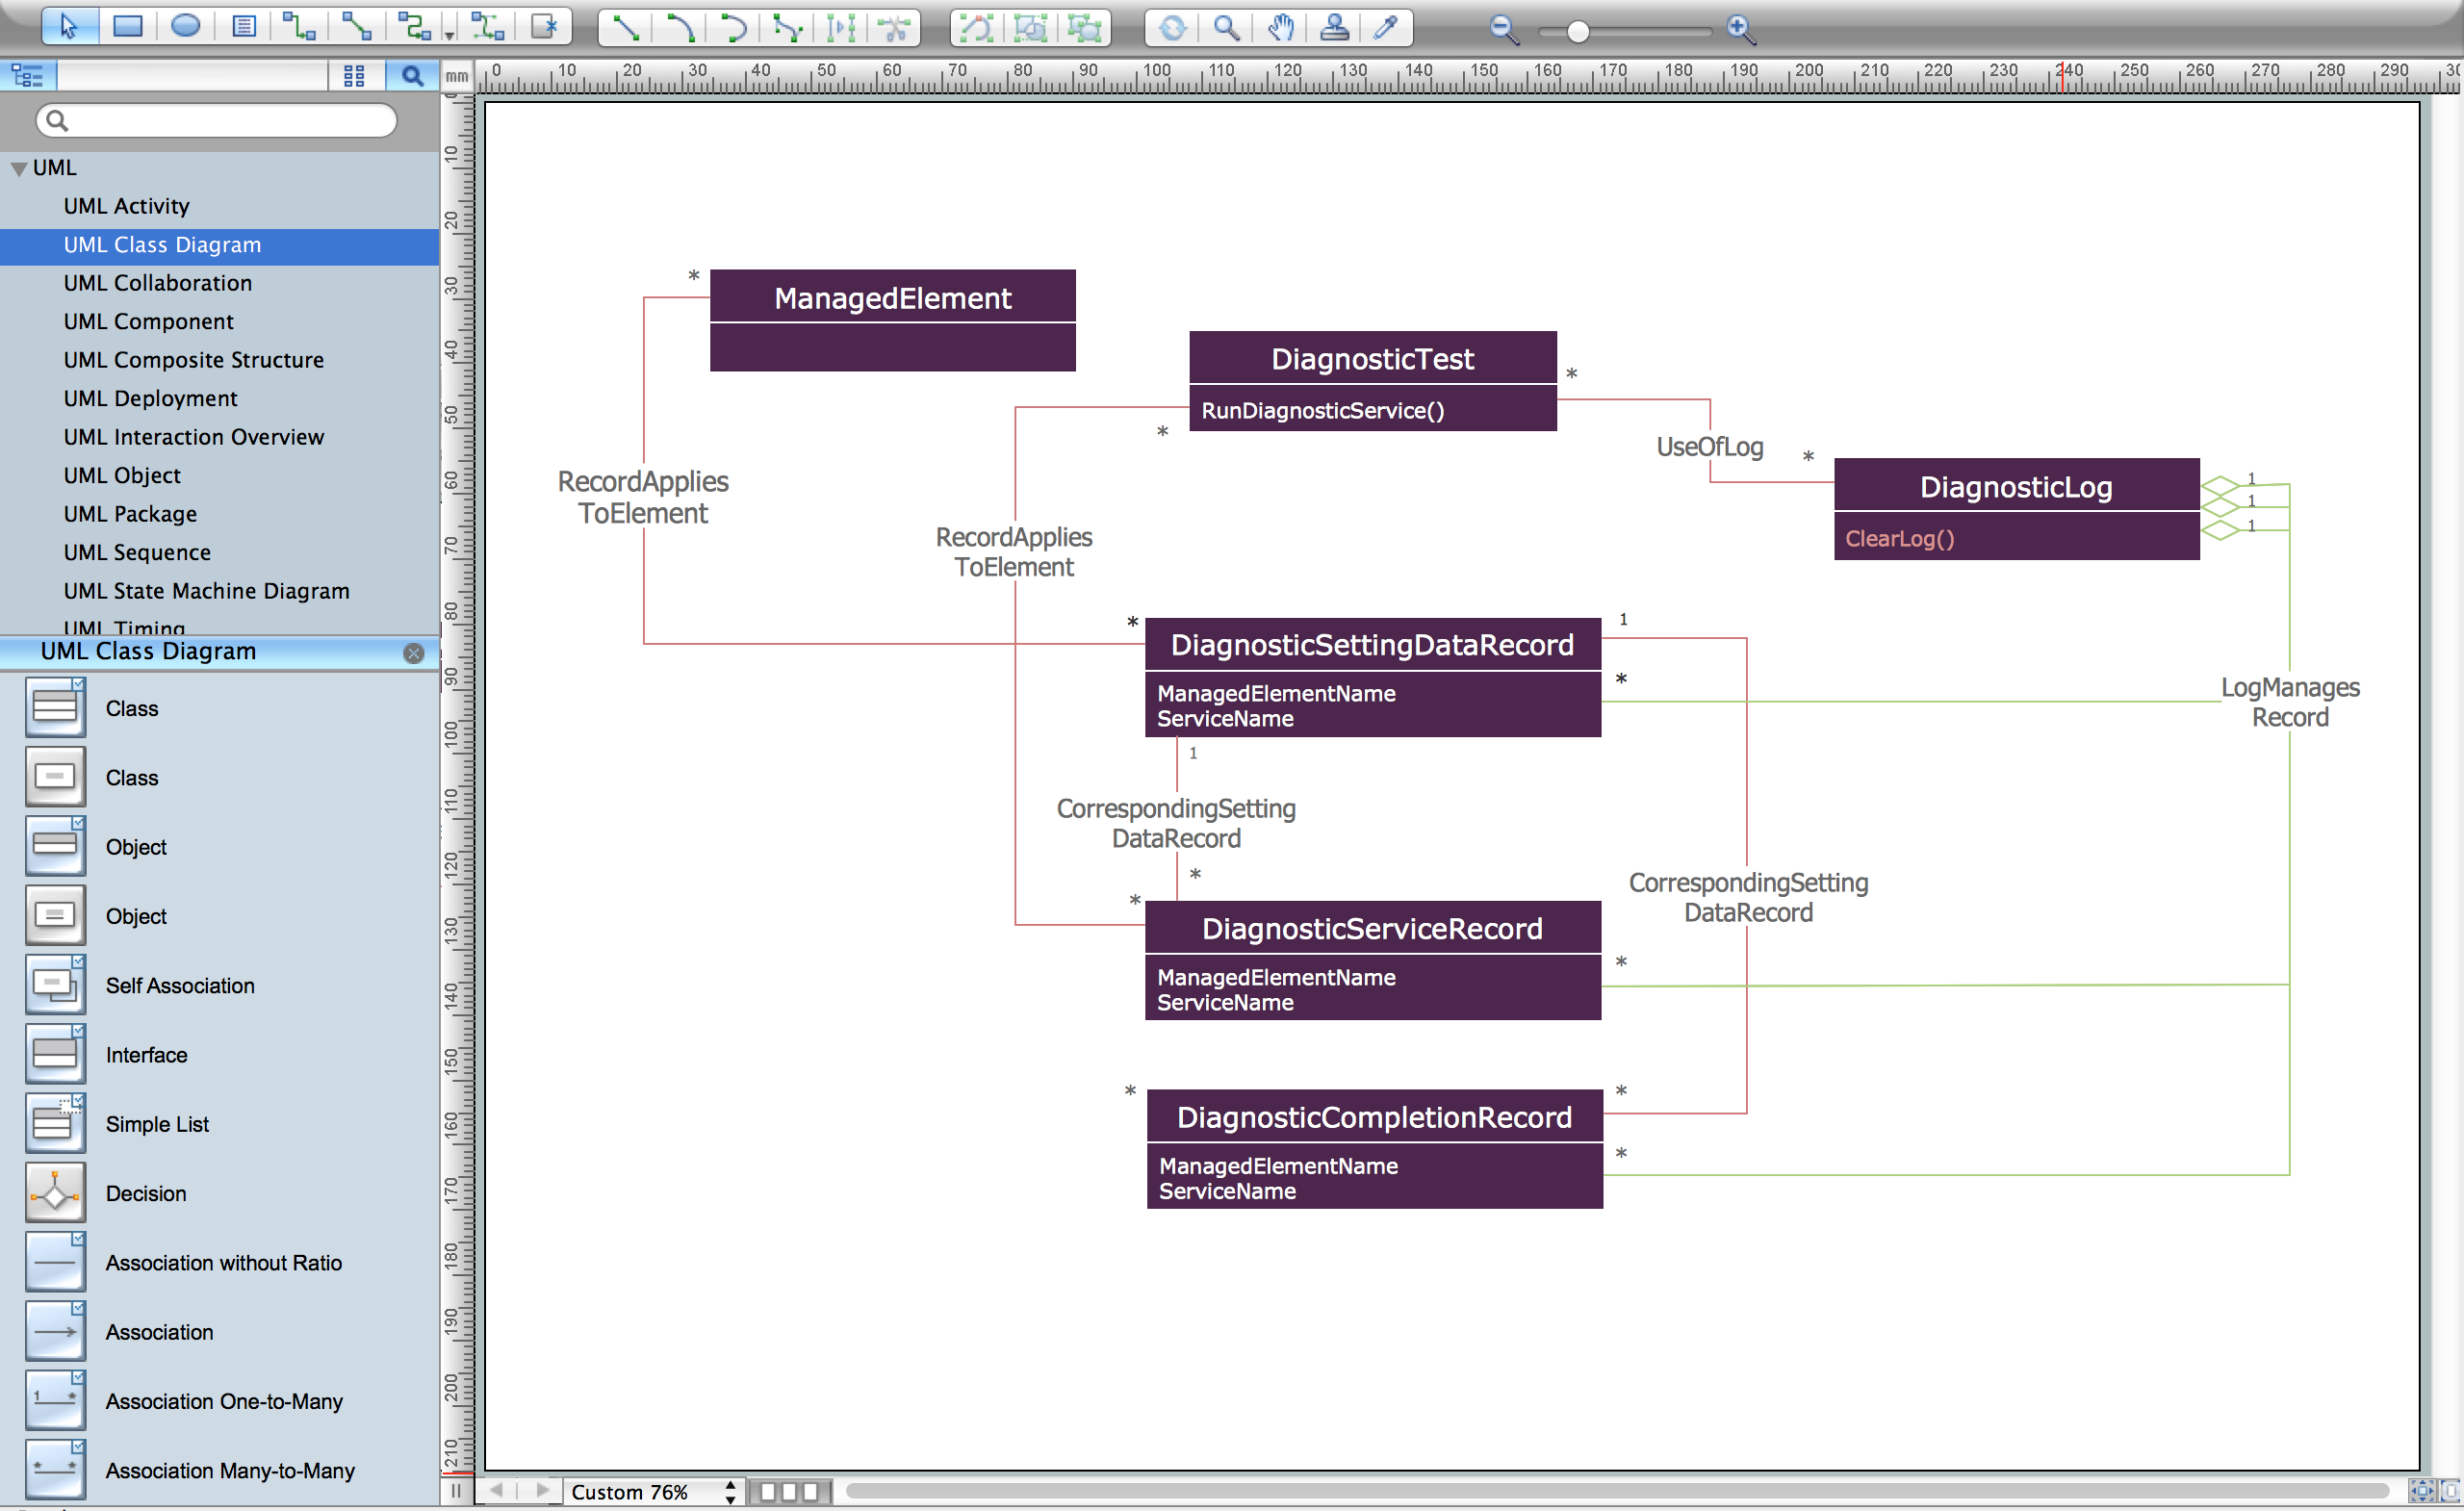
The Rapid UML Solution for ConceptDraw DIAGRAM includes the UML Class Diagram library that helps you to design the UML Class Diagram quick and easy. You can simply and quickly drop the ready-to-use objects from the library into your document to create the UML Class Diagram.
Venn Diagram Examples for Problem Solving. Environmental Social Science. Human Sustainability Confluence

Create your Venn diagrams for problem solving in environmental social science using the ConceptDraw DIAGRAM diagramming and vector drawing software extended with the Venn Diagrams solution from the area "Diagrams" of ConceptDraw Solution Park.
Pyramid Diagram

Pyramid Diagram

SDL Flowchart Symbols

How to Simplify Flow Charting — Cross-functional Flowchart

Pyramid Diagram

Program Structure Diagram

 Network Layout Floor Plans
Network Layout Floor Plans solution extends ConceptDraw DIAGRAM software functionality with powerful tools for quick and efficient documentation the network equipment and displaying its location on the professionally designed Network Layout Floor Plans. Never before creation of Network Layout Floor Plans, Network Communication Plans, Network Topologies Plans and Network Topology Maps was not so easy, convenient and fast as with predesigned templates, samples, examples and comprehensive set of vector design elements included to the Network Layout Floor Plans solution. All listed types of plans will be a good support for the future correct cabling and installation of network equipment.
Pyramid Diagram

- 4 - Set Venn diagram - Template | Circles Venn Diagram | Venn ...
- How To Draw A Venn Diagram With 4 Sets
- Venn Diagram For 4 Sets
- 4 Venn Diagram Generator
- 4 - Set Venn diagram - Template | Inclusion Exclusion Principle Four ...
- Venn Diagram Template
- 4 - Set Venn diagram - Template | Pyramid Diagram | Venn Diagram ...
- 4 - Set Venn diagram - Template
- 4 Circle Venn Diagram Template
- 4 - Set Venn diagram - Template | Venn Diagram | Venn Diagram ...
- 4 - Set Venn diagram - Template | Venn diagrams - Vector stencils ...
- Sets And Venn Diagrams
- Venn Diagram Maker | Flow Chart Creator | 4 - Set Venn diagram ...
- 4 - Set Venn diagram
- 5- Set Venn diagram - Template
- Four Circle Venn Diagram
- Circles Venn Diagram
- Examples Of Ven Diagram That Contained Four Sets
- Venn Diagram Calculator 4 Sets
- Venn Diagram Template | 3 Circle Venn Diagram . Venn Diagram ...
- ERD | Entity Relationship Diagrams, ERD Software for Mac and Win
- Flowchart | Basic Flowchart Symbols and Meaning
- Flowchart | Flowchart Design - Symbols, Shapes, Stencils and Icons
- Flowchart | Flow Chart Symbols
- Electrical | Electrical Drawing - Wiring and Circuits Schematics
- Flowchart | Common Flowchart Symbols
- Flowchart | Common Flowchart Symbols