3 Circle Venn Diagram. Venn Diagram Example

Venn Diagrams visualize all possible logical intersections between several sets and are widely used in mathematics, logic, statistics, marketing, sociology, etc.
3 Circle Venn. Venn Diagram Example

Circles Venn Diagram

Venn Diagram Examples for Problem Solving. Venn Diagram as a Truth Table

What Is a Circle Spoke Diagram

Cylinder Venn Diagram

Venn Diagram

2 Circle Venn Diagram. Venn Diagram Example

Circle Spoke Diagram Template

Interactive Venn Diagram
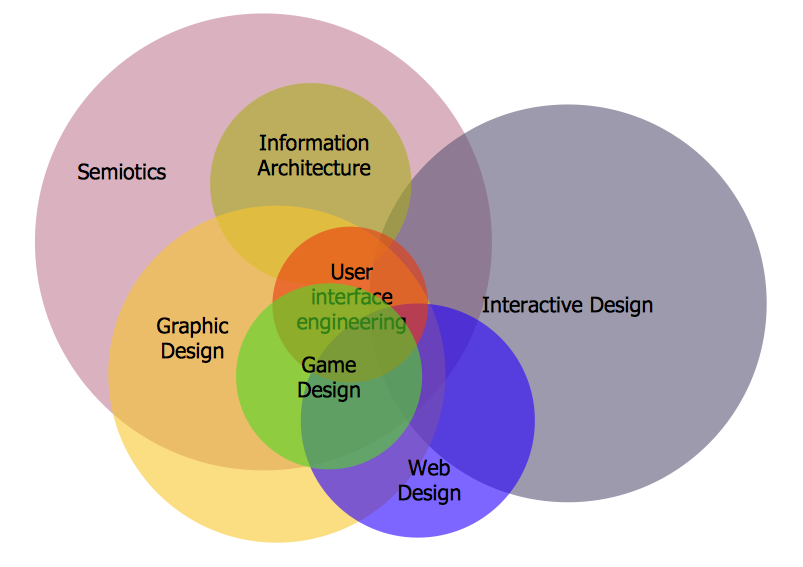
Venn Diagrams designed in ConceptDraw DIAGRAM are visual, bright, colorful, so they can be successfully used in different reports, appearances on the conferences, meetings.
Circular Diagram

Example of Flowchart Diagram

UML Class Diagram Constructor
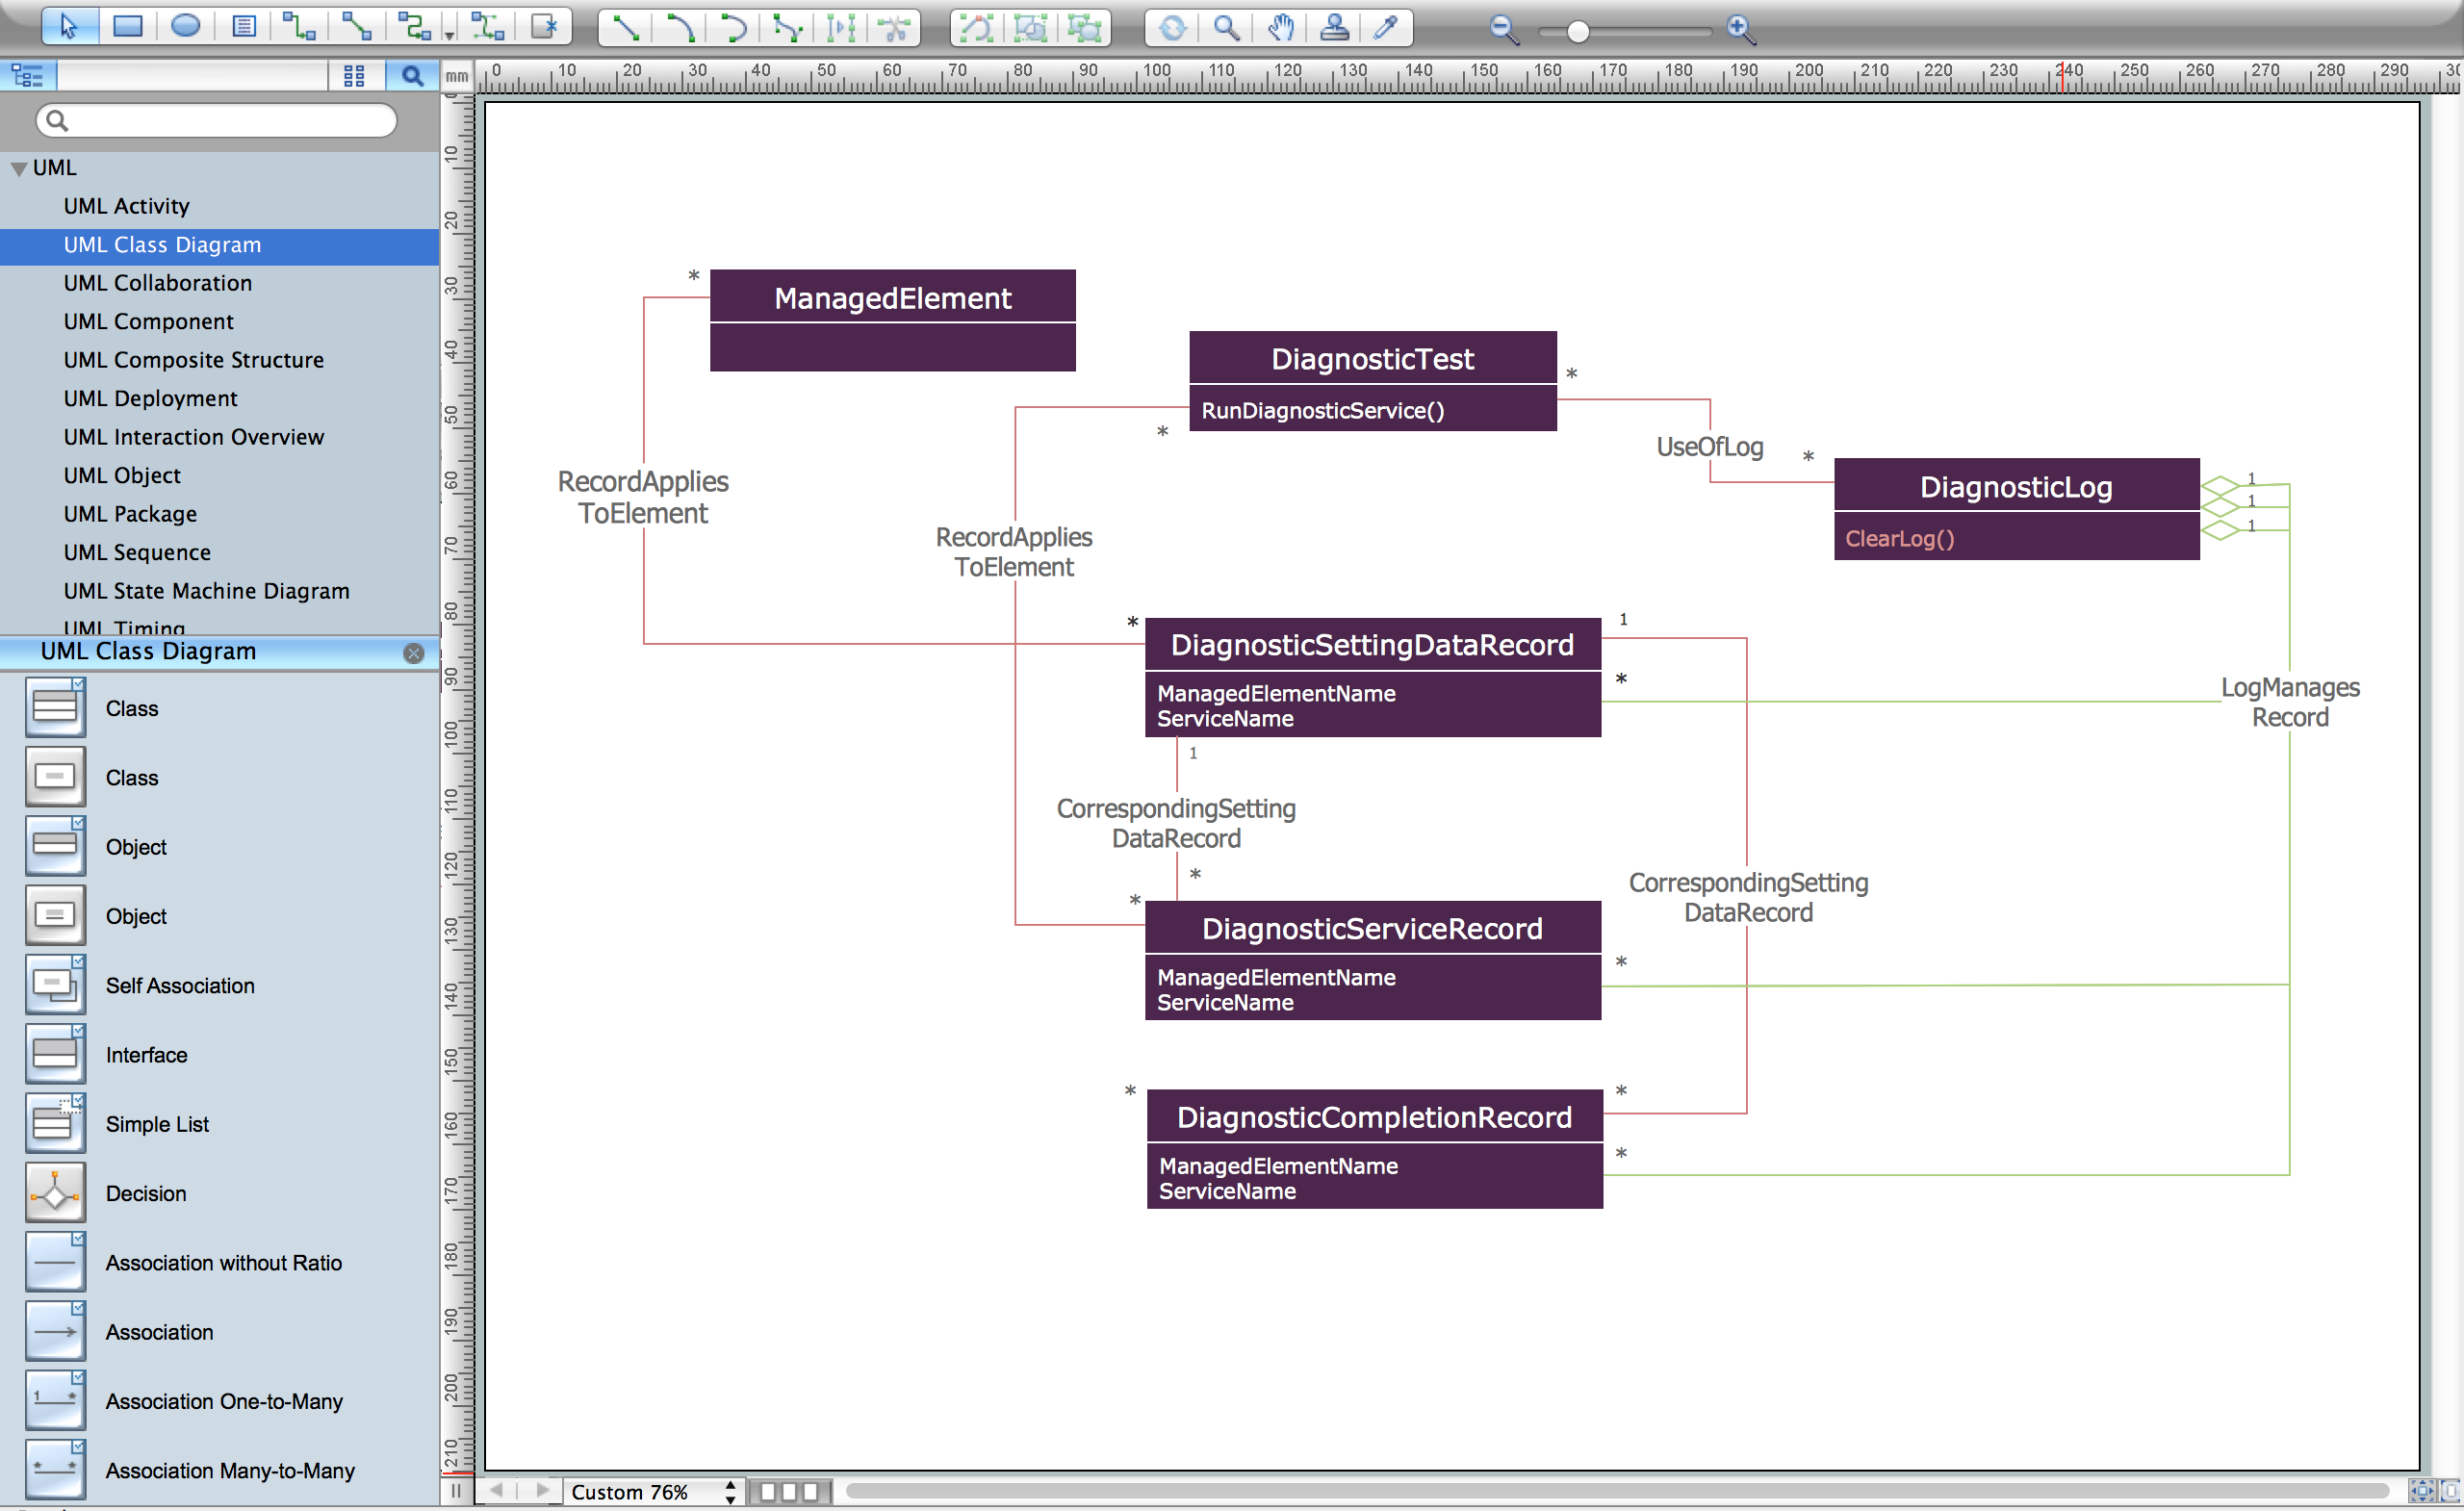
The Rapid UML Solution for ConceptDraw DIAGRAM includes the UML Class Diagram library that helps you to design the UML Class Diagram quick and easy. You can simply and quickly drop the ready-to-use objects from the library into your document to create the UML Class Diagram.
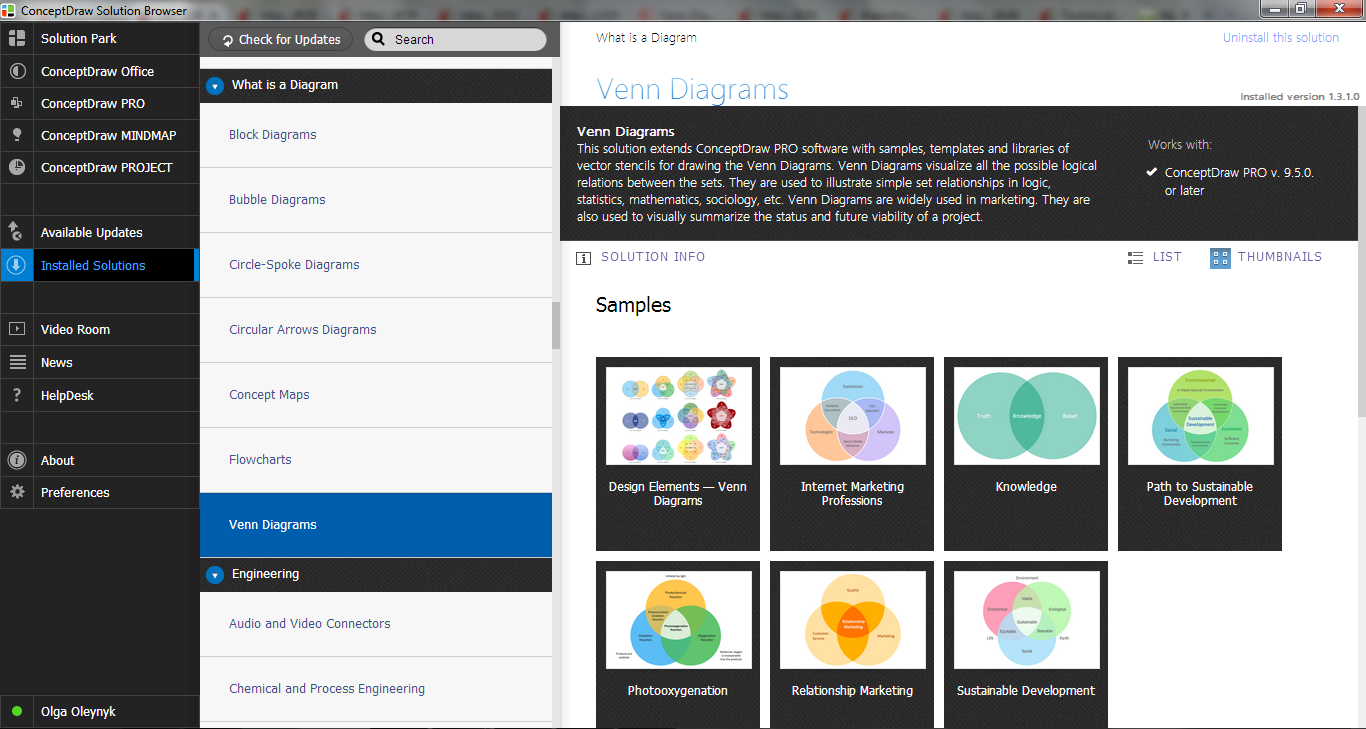
Venn Diagram Examples
SWOT Analysis Tool for Small Business

- 3 Circle Venn Diagram . Venn Diagram Example | Circles Venn ...
- 2 Circle Venn Diagram . Venn Diagram Example | Venn Diagram | 3 ...
- 3 Circle Venn. Venn Diagram Example | Venn diagrams - Vector ...
- 3 Circle Venn. Venn Diagram Example | Venn Diagram Examples ...
- 3 Circle Venn. Venn Diagram Example
- 3 Circle Venn Diagram . Venn Diagram Example | 3 Circle Venn ...
- Circle Spoke Diagram Template | 3 Circle Venn Diagram . Venn ...
- Venn Diagram Template | Venn Diagram Maker | 3 Circle Venn ...
- 3 Circle Venn Diagram . Venn Diagram Example | 2 Circle Venn ...
- 3 Circle Venn Diagram . Venn Diagram Example
- 3 Circle Venn Diagram . Venn Diagram Example | Venn Diagrams ...
- Venn Diagram Maker | 3 Circle Venn. Venn Diagram Example ...
- 3 Circle Venn Diagram . Venn Diagram Example | Circular diagrams ...
- Research cycle - Circle diagram | 3 Circle Venn Diagram . Venn ...
- Venn Diagram | 3 Circle Venn Diagram . Venn Diagram Example ...
- Basic Diagramming | 3 Circle Venn Diagram . Venn Diagram ...
- 3 Circle Venn Diagram . Venn Diagram Example | Multi Layer Venn ...
- Venn Diagram Solver 3 Circles
- 5-Set Venn diagram - Template | 4-Set Venn diagram - Template | 3 ...
- 3 Circle Venn Diagram Examples
- ERD | Entity Relationship Diagrams, ERD Software for Mac and Win
- Flowchart | Basic Flowchart Symbols and Meaning
- Flowchart | Flowchart Design - Symbols, Shapes, Stencils and Icons
- Flowchart | Flow Chart Symbols
- Electrical | Electrical Drawing - Wiring and Circuits Schematics
- Flowchart | Common Flowchart Symbols
- Flowchart | Common Flowchart Symbols