UML Use Case Diagram Example. Registration System
The use case diagram (behavior scenarios, precedents) is the initial conceptual representation of the system during its design and development. This diagram consists of actors, use cases and relationships between them. When constructing a diagram, common notation elements can also be used: notes and extension mechanisms.This sample was created in ConceptDraw DIAGRAM diagramming and vector drawing software using the UML Use Case Diagram library of the Rapid UML Solution from the Software Development area of ConceptDraw Solution Park.
This sample shows the types of user’s interactions with the system and is used at the registration and working with the database system.
UML Diagram Types List
Two types of diagrams are used in UML: Structure Diagrams and Behavior Diagrams. Behavior Diagrams represent the processes proceeding in a modeled environment. Structure Diagrams represent the elements that compose the system.Entity Relationship Diagram - ERD - Software for Design Crows Foot ER Diagrams
Crow's Foot notation was proposed by Gordon Everest. According to this notation, the entity is represented by rectangle, relation is depicted by line which ties two entities involved in a relationship. Entity-relationship diagrams based on both Chen's and Crow's Foot notations, can be easily drawn using the ConceptDraw DIAGRAM ERD diagrams software tools for design element Crow's Foot and Chen from Entity-Relationship Diagram (ERD) solution.
 Vehicular Networking
The Vehicular Networking solution extends the ConceptDraw DIAGRAM software functionality with specialized tools, wide variety of pre-made vector objects, collection of samples and templates in order to help network engineers design vehicular network diagrams for effective network engineering activity, visualize vehicular networks, develop smart transportation systems, design various types of vehicle network management diagrams, regional network diagrams, vehicular communication system diagrams, vehicular ad-hoc networks, vehicular delay-tolerant networks, and other network engineering schemes.
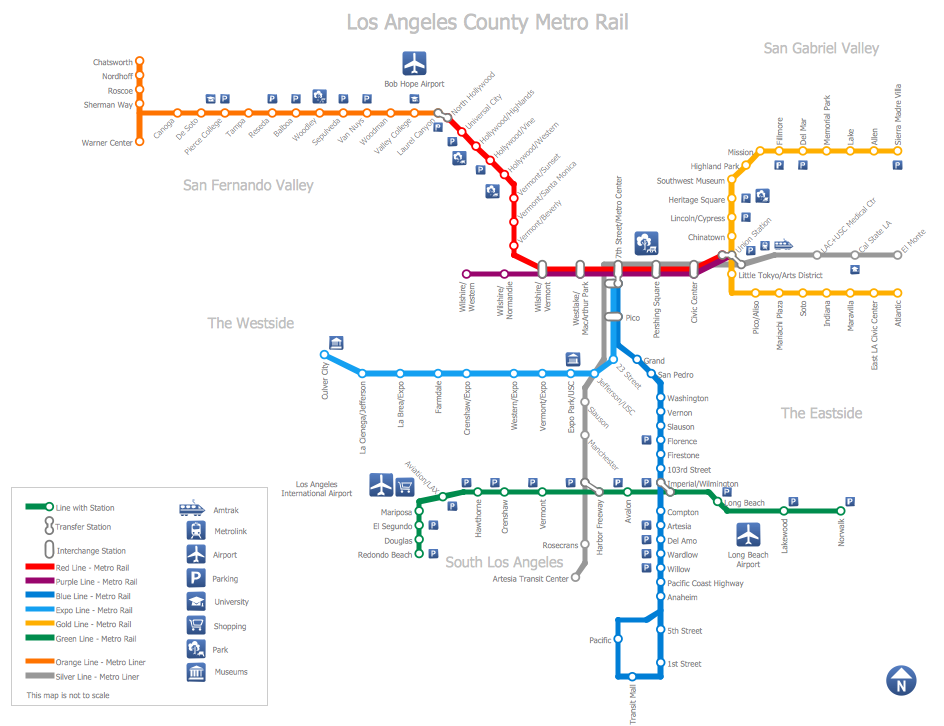
How to draw Metro Map style infographics? (Los Angeles)
Tool to draw Metro Map styled inforgraphics. Los Angeles Metro Rail and Liner sample.This is a one-click tool to add stations to the map. It lets you control the direction in which you create new stations, change lengths, and add text labels and icons. It contains Lines, Stations, and Landmarks objects.
- Class Diagram For Vehicle Registration System
- Vehicle Registration Uml Diagram
- UML Use Case Diagram Example Registration System | Vehicle ...
- UML Use Case Diagram Example Registration System | UML ...
- Use Case Diagram For Vehicle Registration System
- UML Use Case Diagram Example Registration System
- UML Use Case Diagram Example Registration System
- UML Activity Diagram | Process Flowchart | UML Use Case Diagram ...
- UML Use Case Diagram Example Registration System | UML ...
- Uml Diagram For Vehicle Management System
- Sample Of An Activity Diagram For Online Motor Vehicle Registration
- Vehicle Registration System Er Diagram
- Car Registration Class Diagram
- Use Case Diagram For Vehicle Management System
- UML Use Case Diagram Example Registration System | UML ...
- Use Case Diagram For Online Vehicle Management System
- UML Use Case Diagram Example Registration System | Process ...
- Use Case Class Diagram And Object Diagram For Car Company
- Class Diagram For Vehicle Management System
- UML Use Case Diagram Example Registration System | Vehicular ...
- ERD | Entity Relationship Diagrams, ERD Software for Mac and Win
- Flowchart | Basic Flowchart Symbols and Meaning
- Flowchart | Flowchart Design - Symbols, Shapes, Stencils and Icons
- Flowchart | Flow Chart Symbols
- Electrical | Electrical Drawing - Wiring and Circuits Schematics
- Flowchart | Common Flowchart Symbols
- Flowchart | Common Flowchart Symbols


_Win_Mac.png)
