The vector stencils library "European country flags" contains 51 clipart images of Europe state flags.
Use the European country flags clip art to illustrate your business documents, presentation slides, web pages, geo maps and infographics.
The clip art example "European country flags - Vector stencils library" was created using the ConceptDraw PRO diagramming and vector drawing software extended with the Artwork solution from the Illustration area of ConceptDraw Solution Park.
Flag of Europe

Flag of Benelux
Flag of Albania
Flag of Andorra
Flag of Armenia

Flag of Austria

Flag of Azerbaijan
Flag of Belarus

Flag of Belgium
Flag of Bosnia and Herzegovina

Flag of Bulgaria
Flag of Croatia
Flag of Cyprus
Flag of Czech Republic
Flag of Denmark
Flag of Estonia
Flag of Finland
Flag of France
Flag of Georgia
Flag of Germany

Flag of Greece

Flag of Hungary
Flag of Iceland
Flag of Ireland
Flag of Italy
Flag of Kazakhstan

Flag of Latvia

Flag of Liechtenstein

Flag of Lithuania

Flag of Luxembourg

Flag of the Republic of Macedonia
Flag of Malta
Flag of Moldova
Flag of Monaco
Flag of Montenegro
Flag of the Netherlands

Flag of Norway
Flag of Poland
Flag of Portugal
Flag of Romania

Flag of Russia
Flag of San Marino
Flag of Serbia
Flag of Slovakia
Flag of Slovenia
Flag of Spain
Flag of Sweden
Flag of Switzerland

Flag of Turkey
Flag of Ukraine

Flag of the United Kingdom

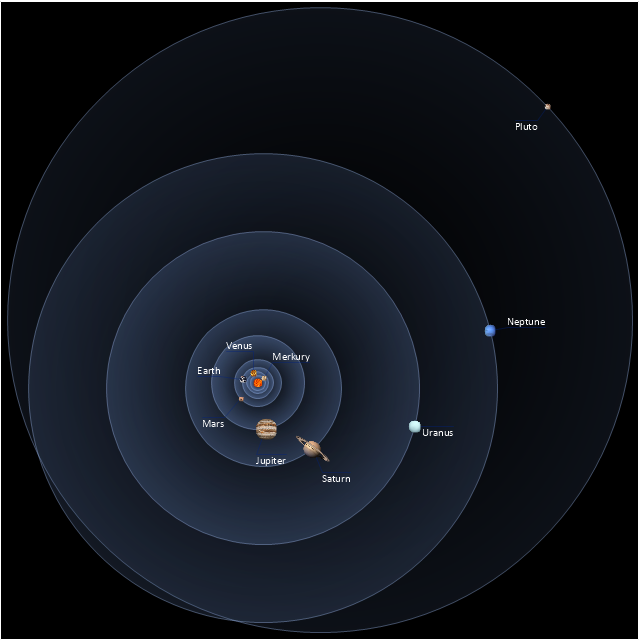
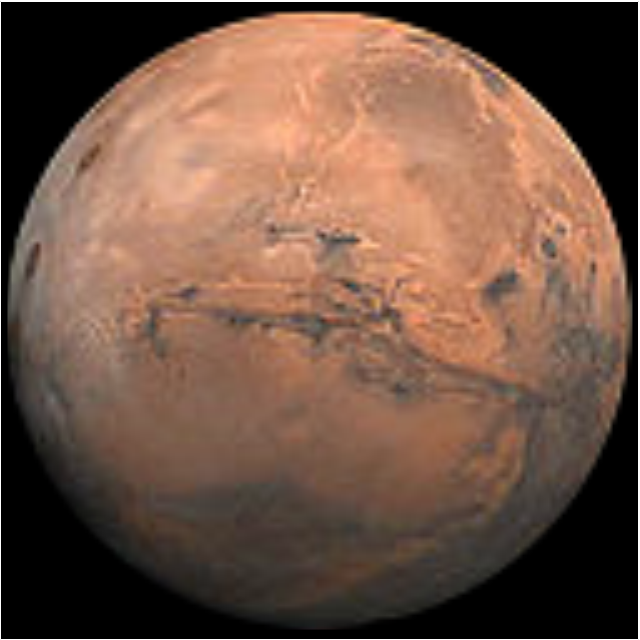
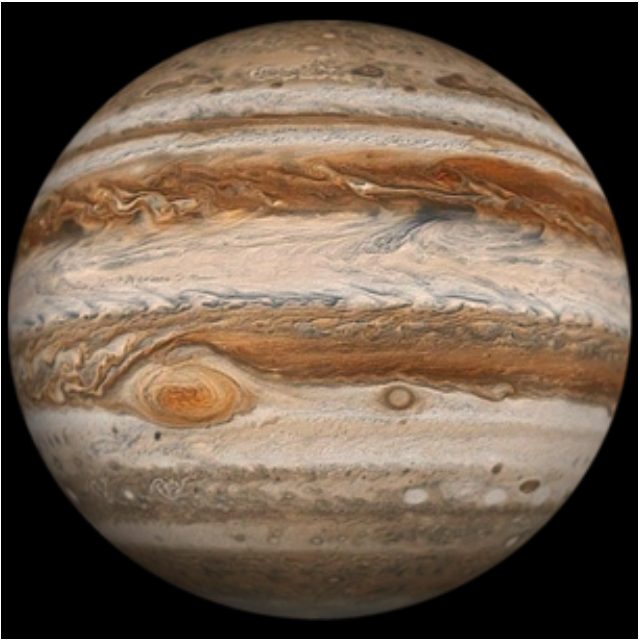
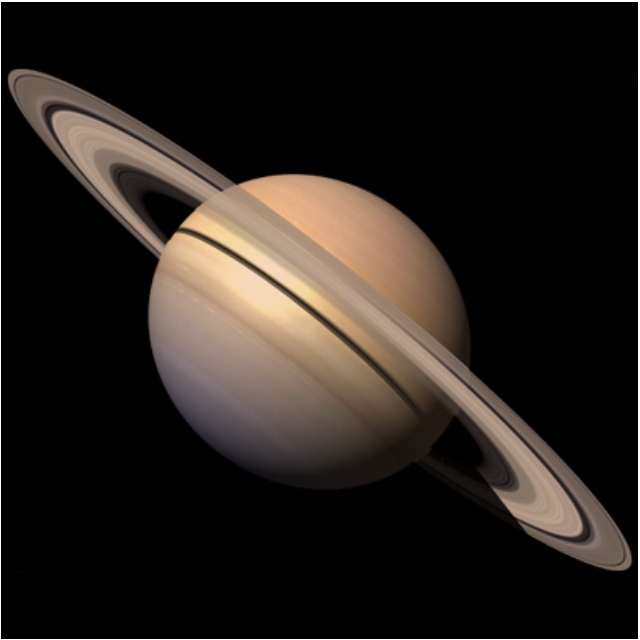
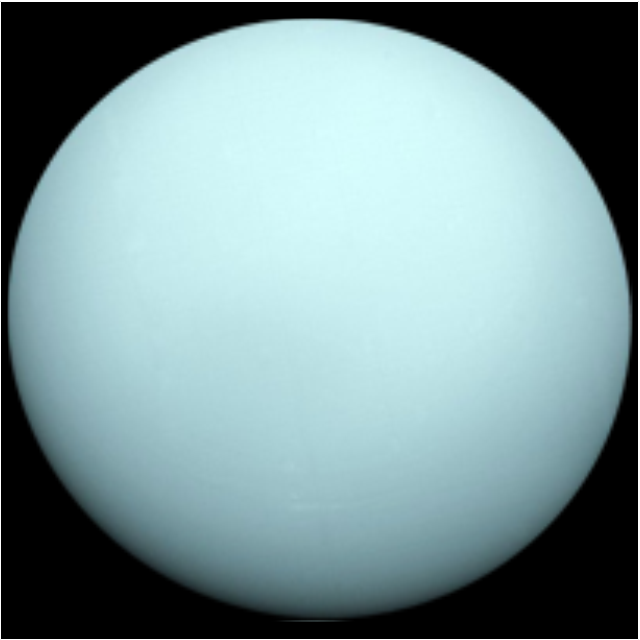
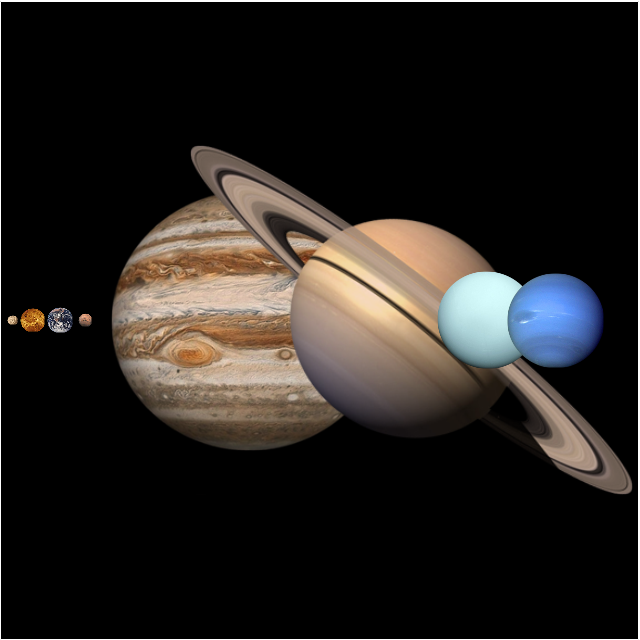
This vector stencils library contains 30 clipart images and astronomical symbols of sun and stars, solar system planets and moon.
Use these shapes for drawing your astronomical diagrams and illustrations.
Use these shapes for drawing your astronomical diagrams and illustrations.
Solar system
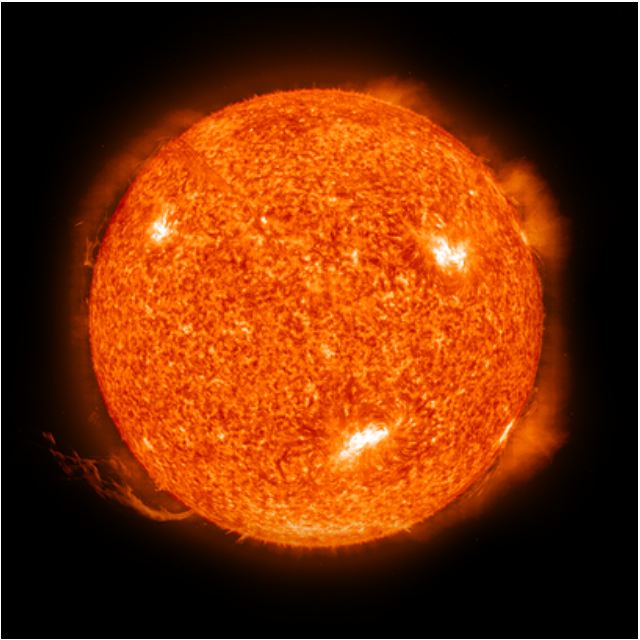
Sun
Mercury
Venus
Earth
Moon
Mars
Jupiter
Saturn
Uranus
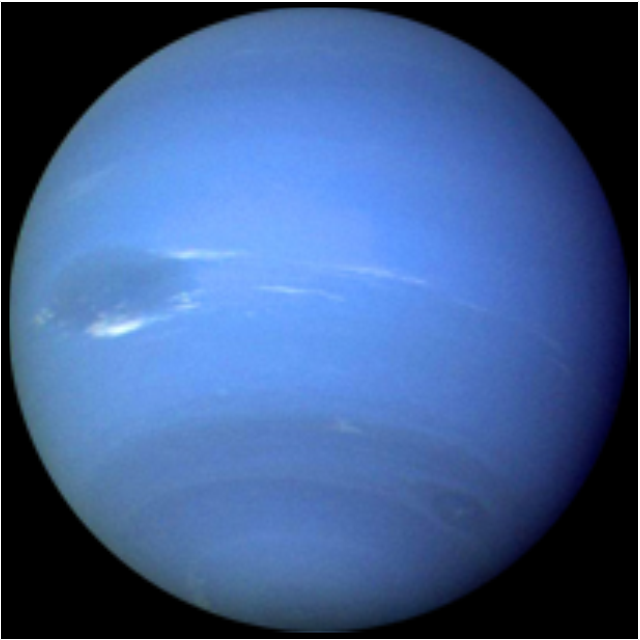
Neptune
Pluto

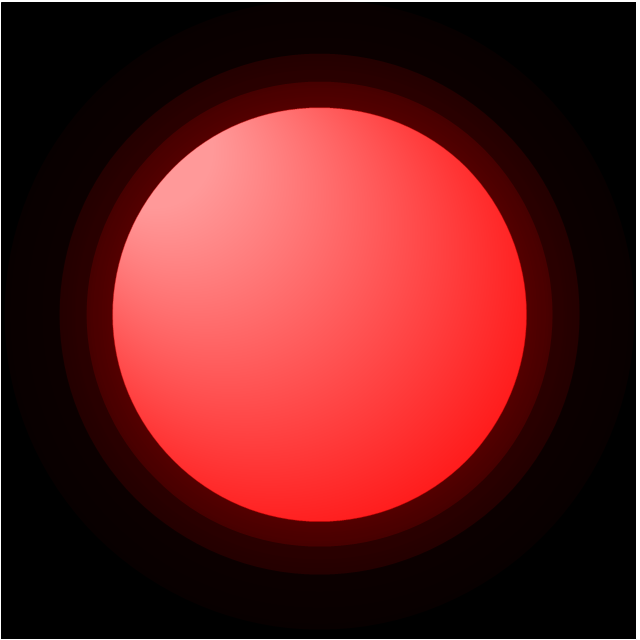
Red giant
Yellow giant

Blue giant

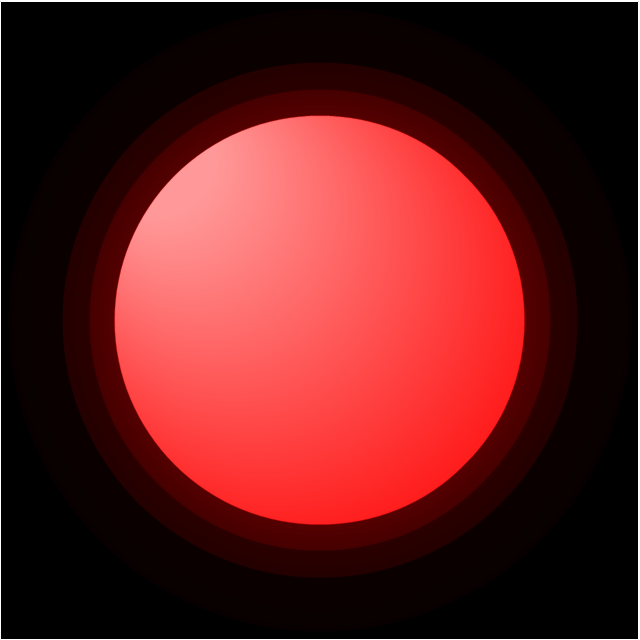
Red dwarf
White dwarf

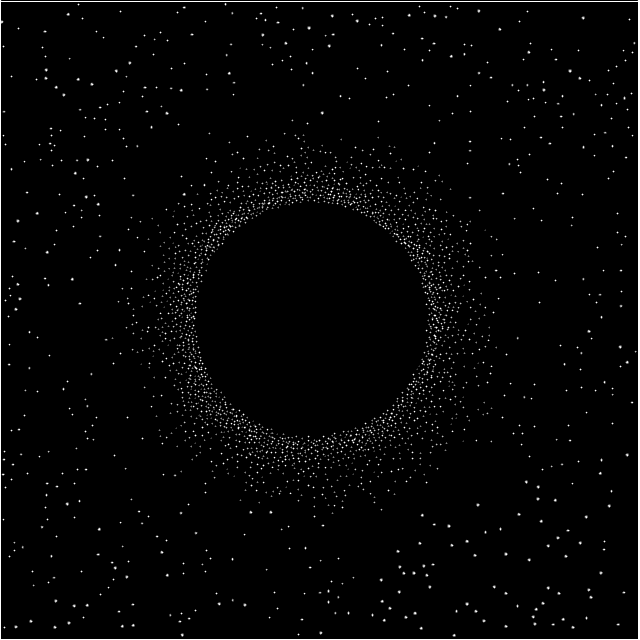
Black hole
Planets to scale
Sun symbol

Mercury symbol

Venus symbol

Earth symbol
Moon symbol

Mars symbol
Jupiter symbol

Saturn symbol

Neptune symbol

Uranus symbol
Pluto symbol

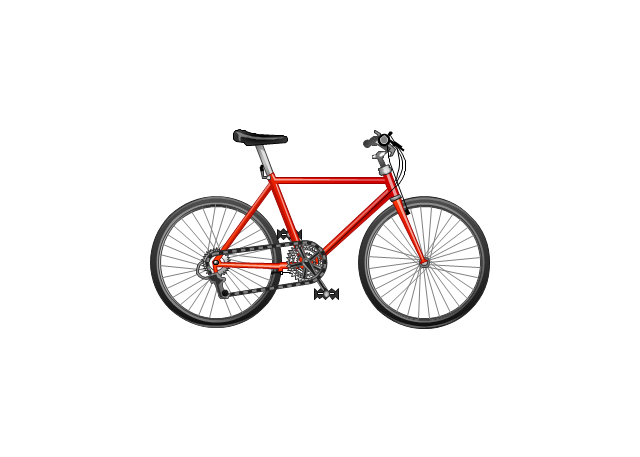
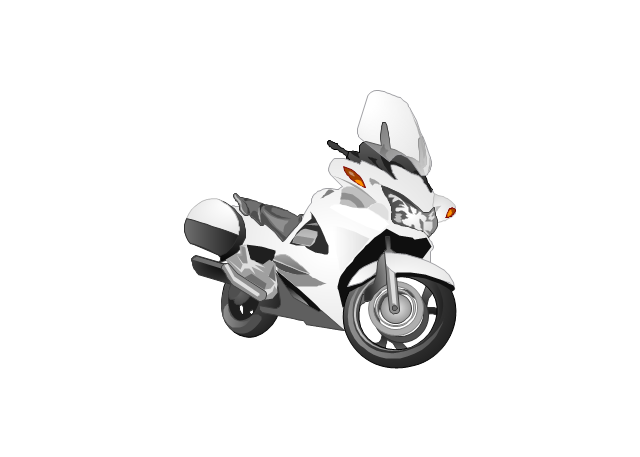
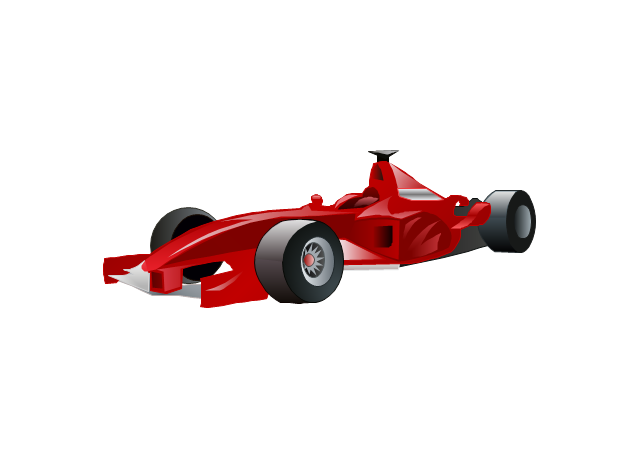
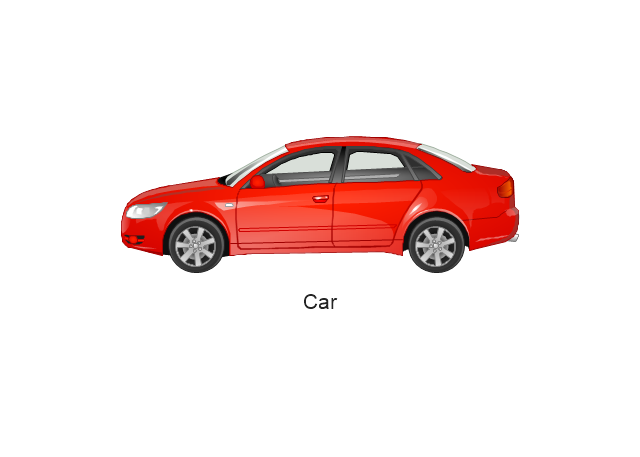
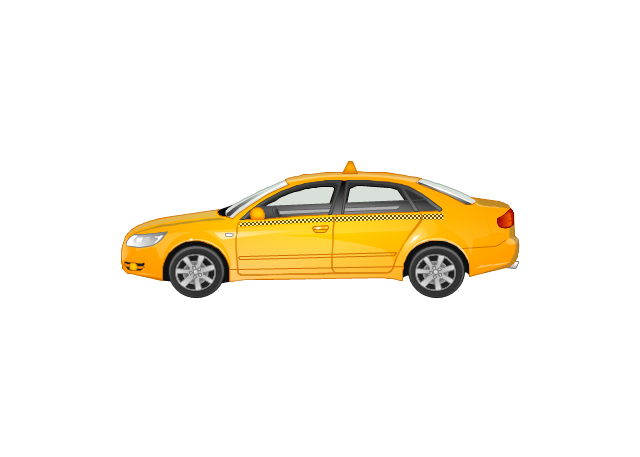
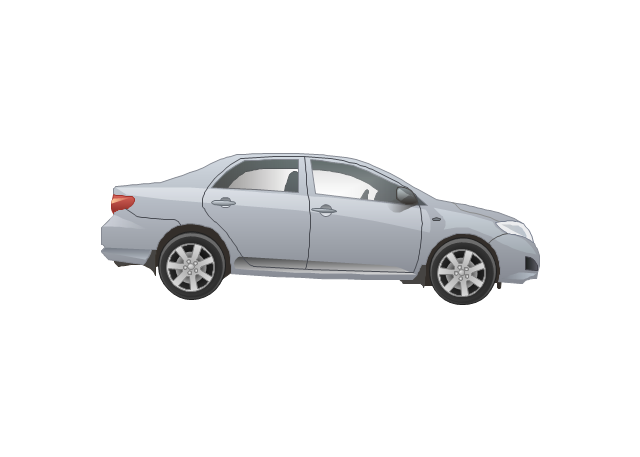
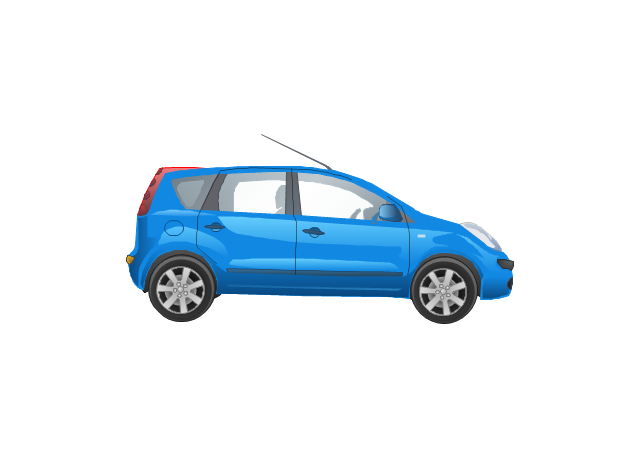
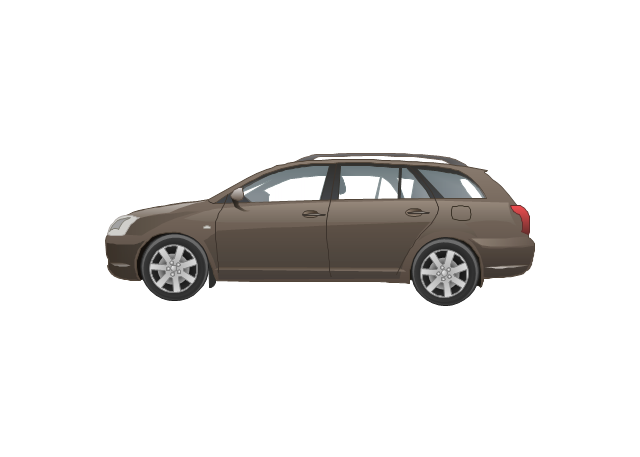
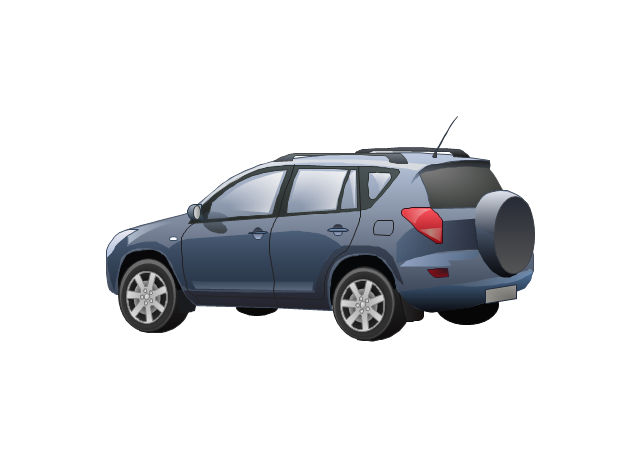
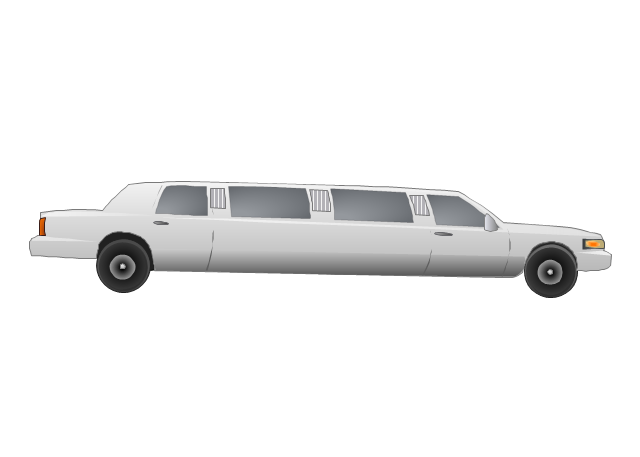
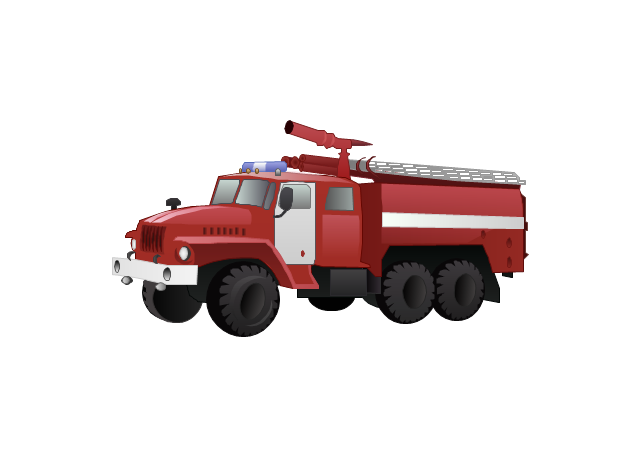
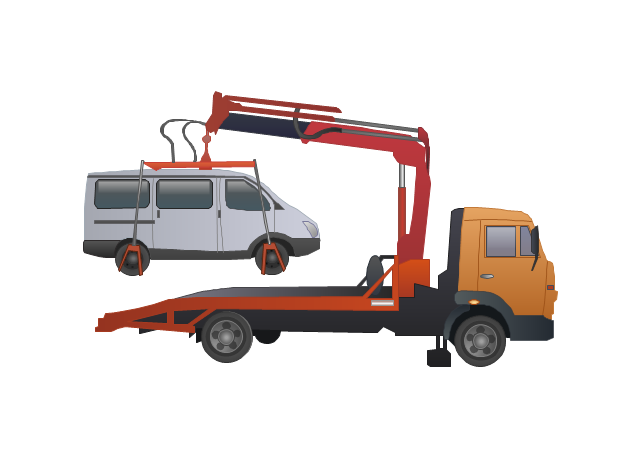
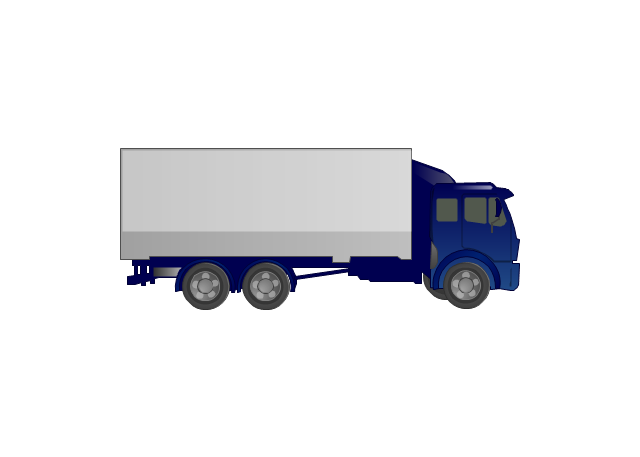
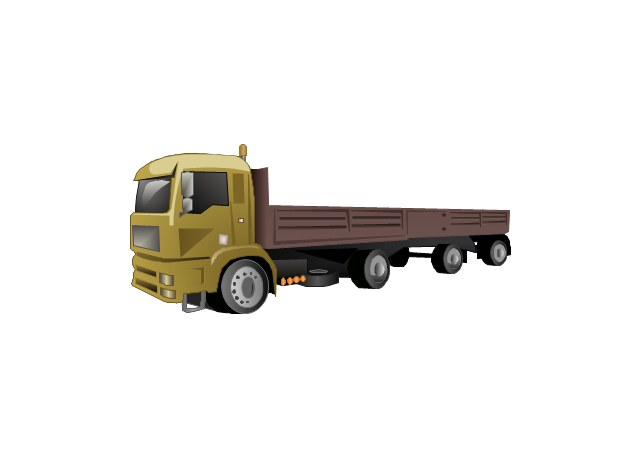
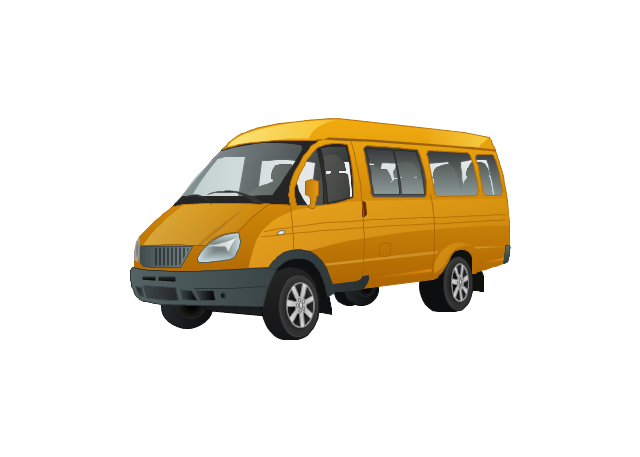
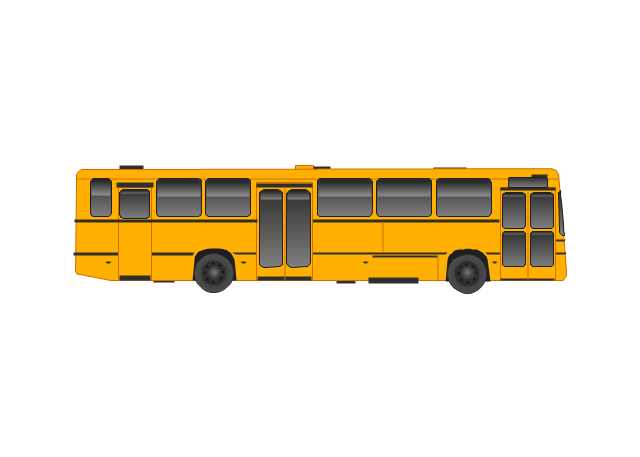
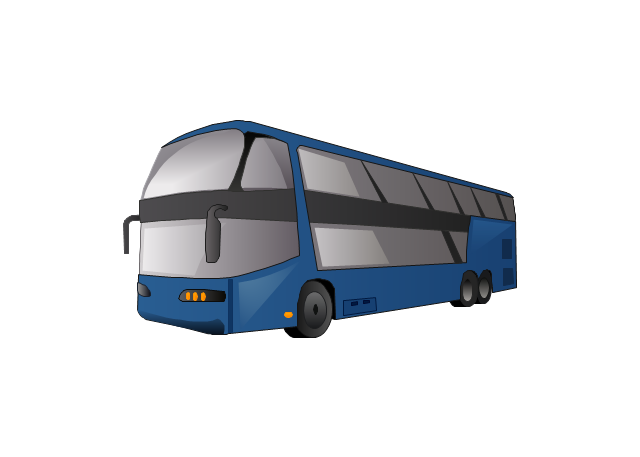
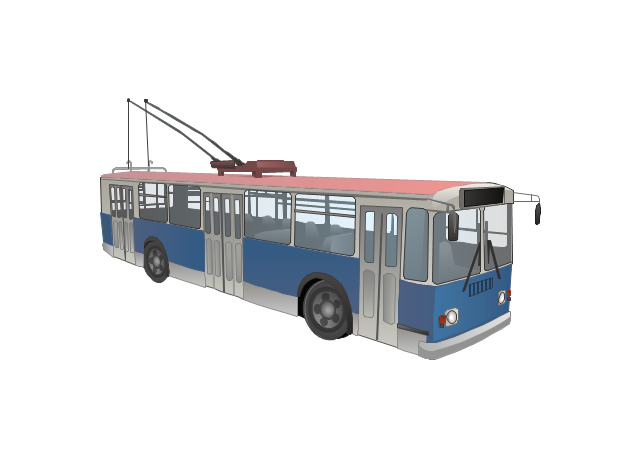
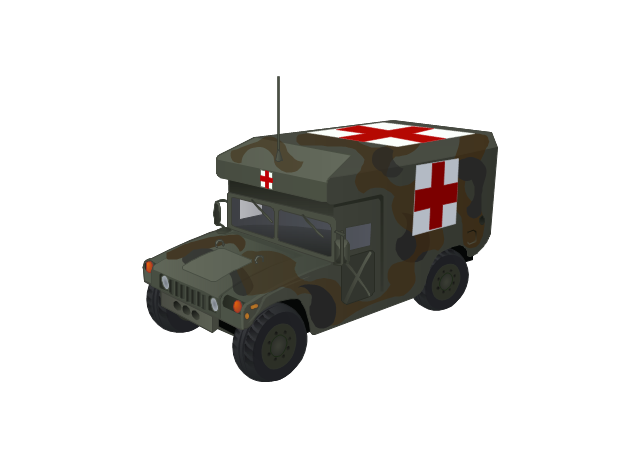
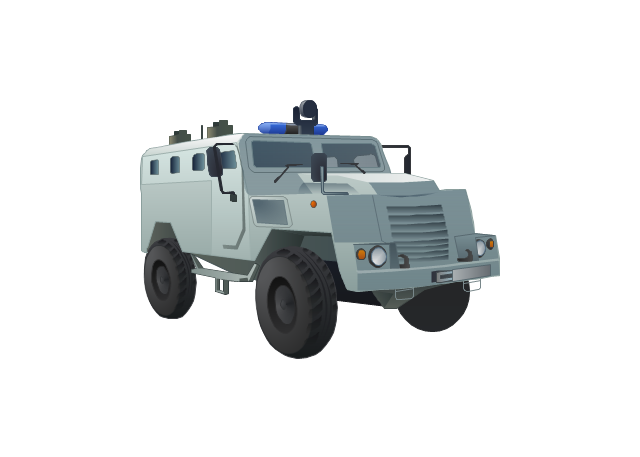
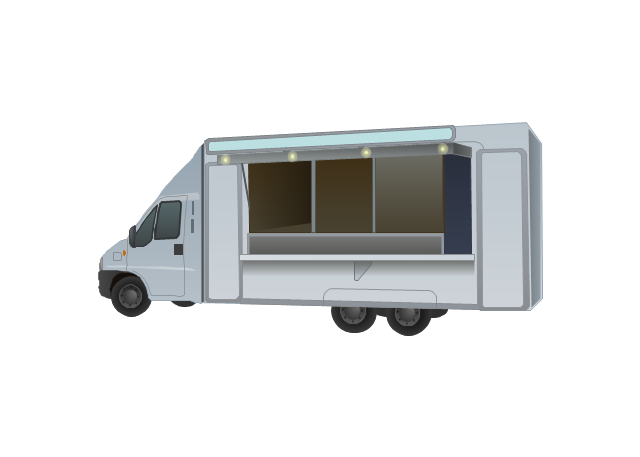
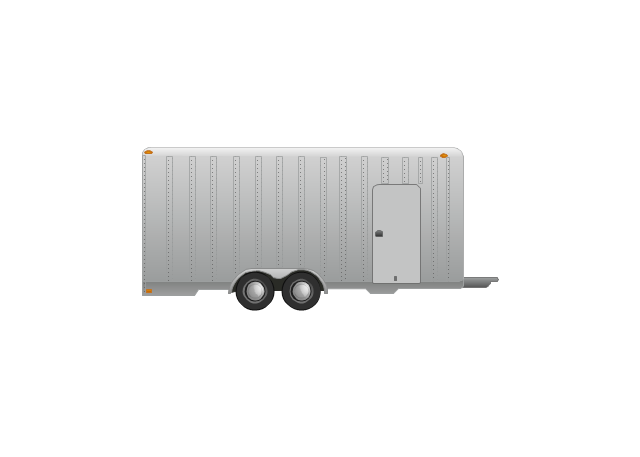
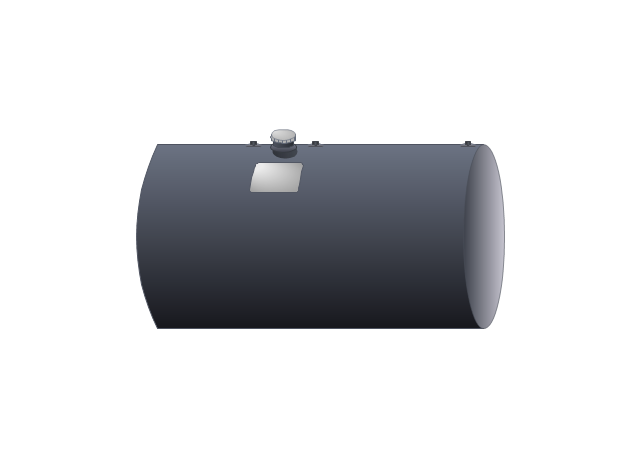
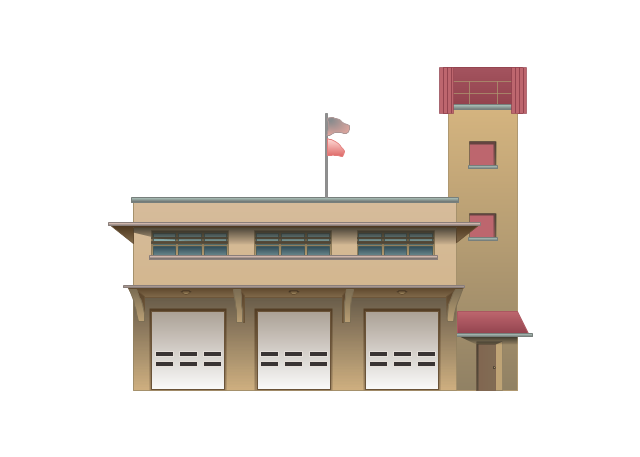
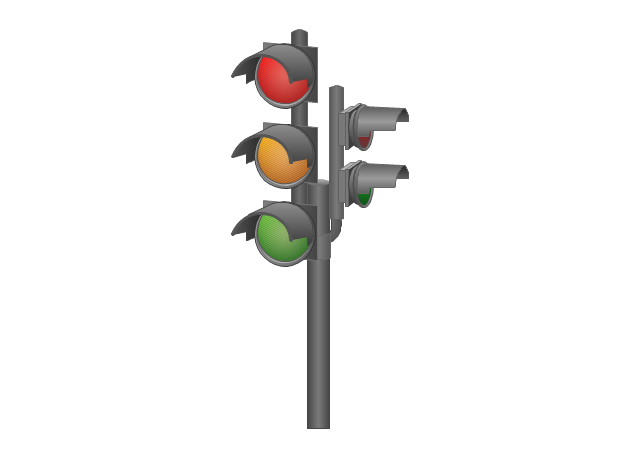
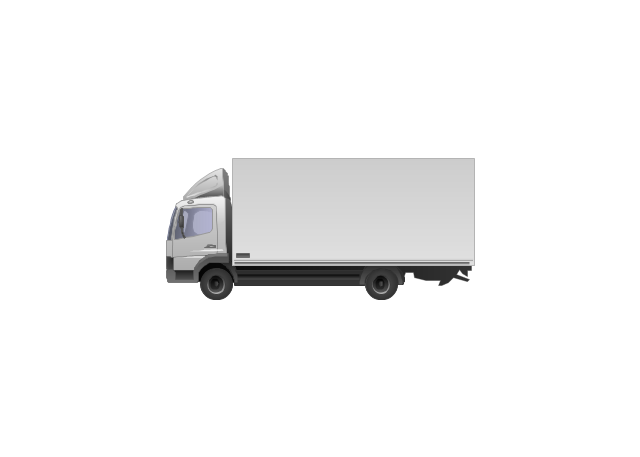
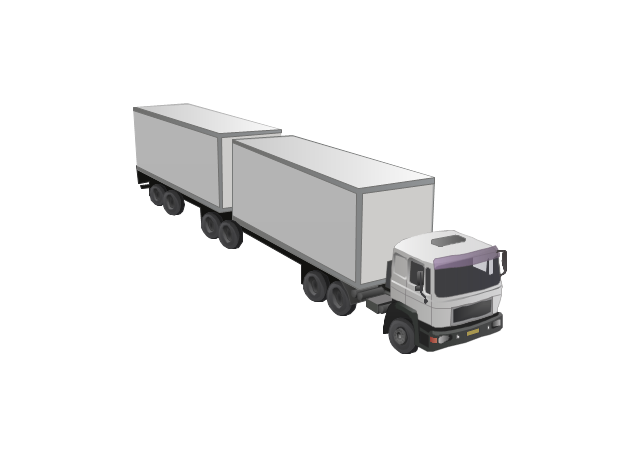
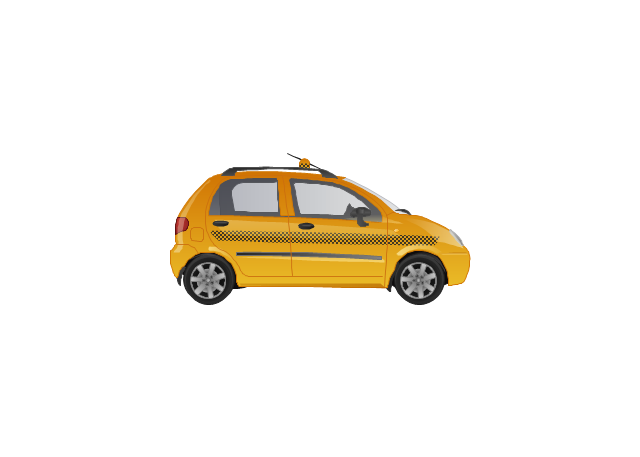
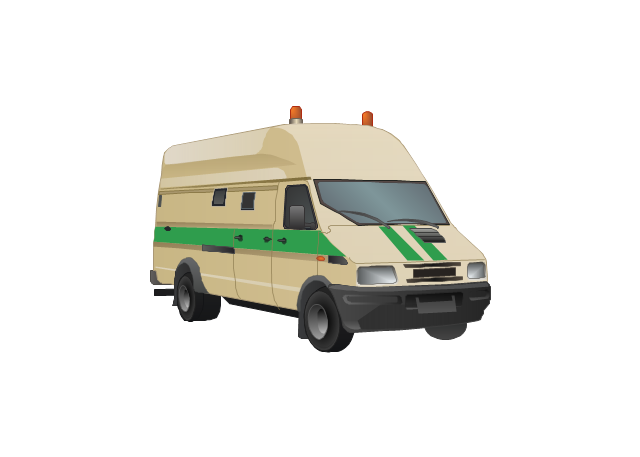
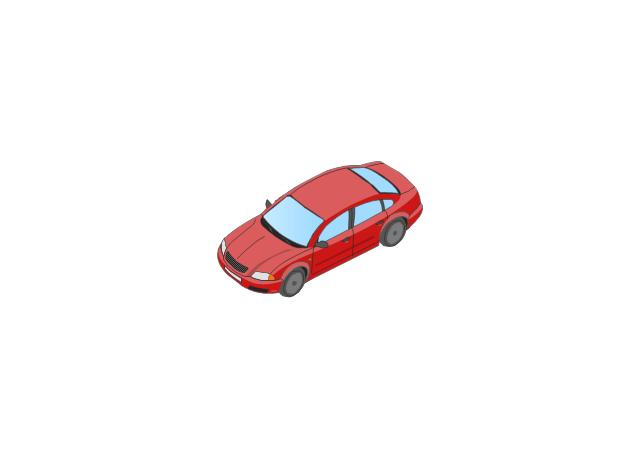
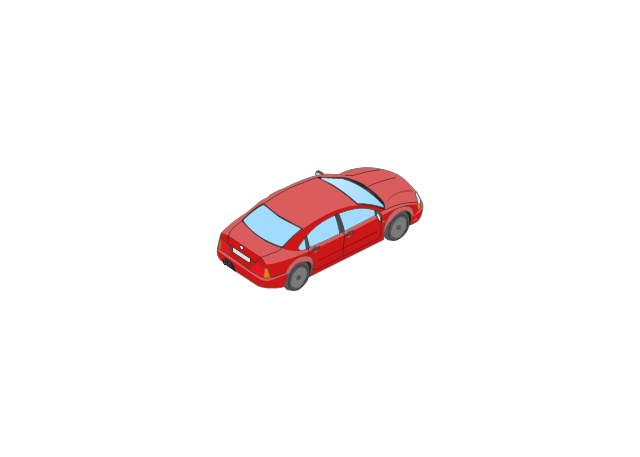
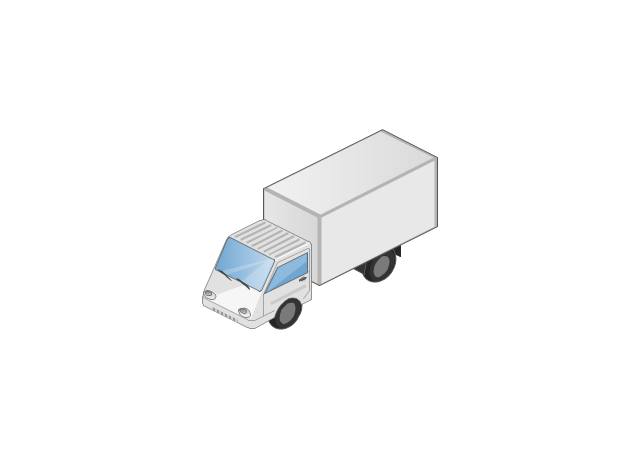
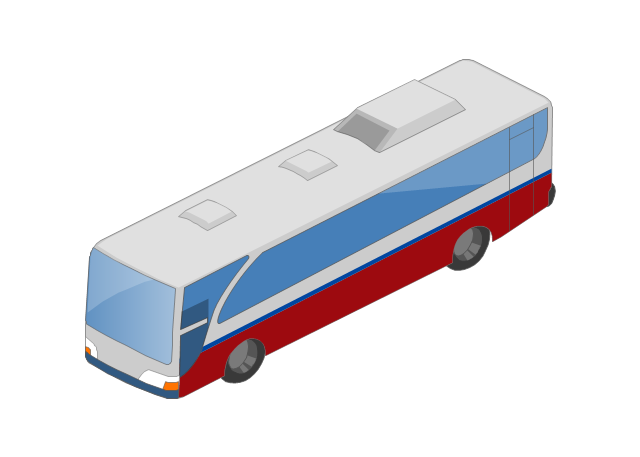
The vector stencils library "Road transport" contains 43 clip art images for creating vehicles and transportation illustrations, presentation slides, infographics and webpages using the ConceptDraw PRO diagramming and vector drawing software.
"Road transport (British English) or road transportation (American English) is the transport of passengers or goods on roads. ...
Transportation.
Transport on roads can be roughly grouped into the transportation of goods and transportation of people. In many countries licencing requirements and safety regulations ensure a separation of the two industries.
The nature of road transportation of goods depends, apart from the degree of development of the local infrastructure, on the distance the goods are transported by road, the weight and volume of the individual shipment, and the type of goods transported. For short distances and light, small shipments a van or pickup truck may be used. For large shipments even if less than a full truckload a truck is more appropriate. In some countries cargo is transported by road in horse-drawn carriages, donkey carts or other non-motorized mode. Delivery services are sometimes considered a separate category from cargo transport. In many places fast food is transported on roads by various types of vehicles. For inner city delivery of small packages and documents bike couriers are quite common.
People are transported on roads either in individual cars or automobiles, or in mass transit by bus or coach. Special modes of individual transport by road like rickshaws or velotaxis may also be locally available." [Road transport. Wikipedia]
The vector stencils library "Road transport" is included in the Aerospace and Transport solution from the Illustrations area of ConceptDraw Solution Park.
www.conceptdraw.com/ solution-park/ illustrations-aerospace-transport
Bicycle
Motorcycle
Race car
Car
Taxi
Sedan
Hatchback
Estate car
4x4
Limousine
Police car

Ambulance

Fire apparatus
Wrecker
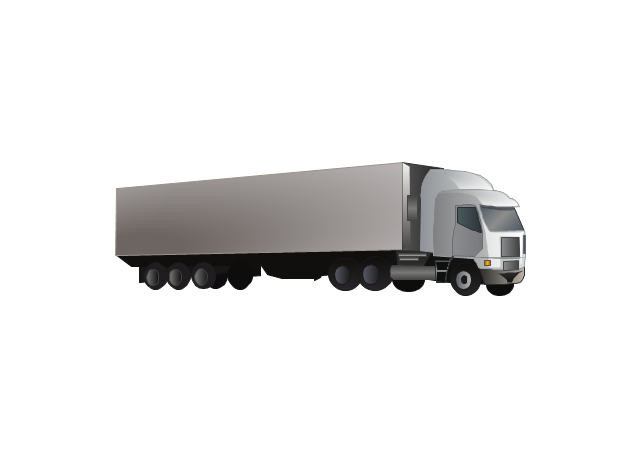
Semi truck

Truck
Trailer
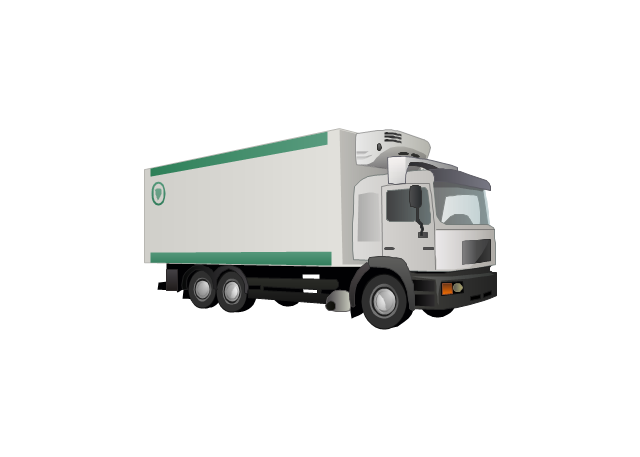
Refrigeration Truck
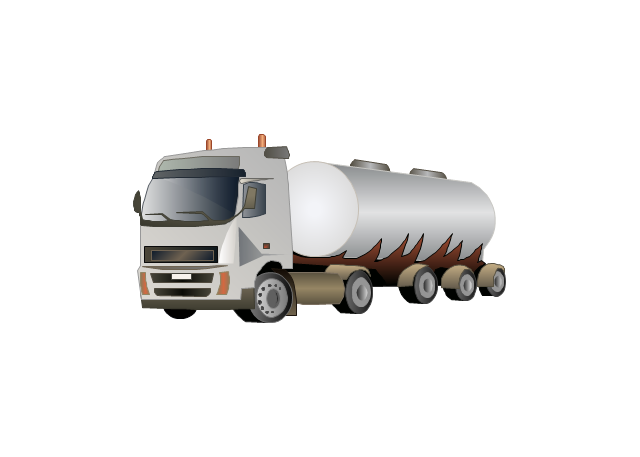
Petrol Tanker
Truck
Minibus
City Bus
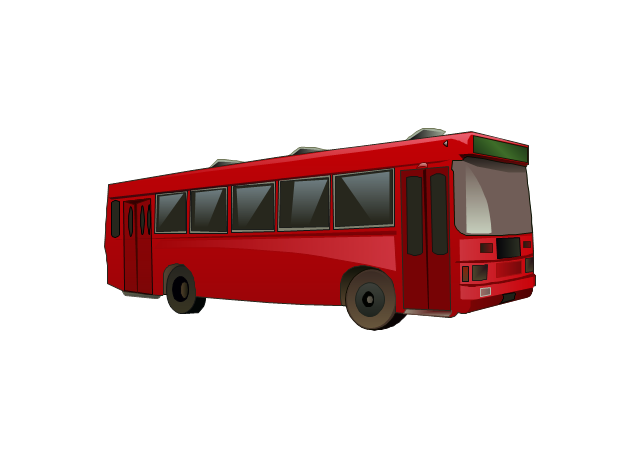
Bus
Sightseeing Bus

Double-decker Bus
Trolleybus
Military Ambulance
Armored police vehicle
First Aid Tent

Catering Vehicle
Semi-trailer
Fuel Tank
Fire Station
Signal Light
Walkie-Talkie

Lorry
B-Train
Taxi
Armored cash transport car
Car isometric
Car isometric
Box truck isometric
Bus isometric
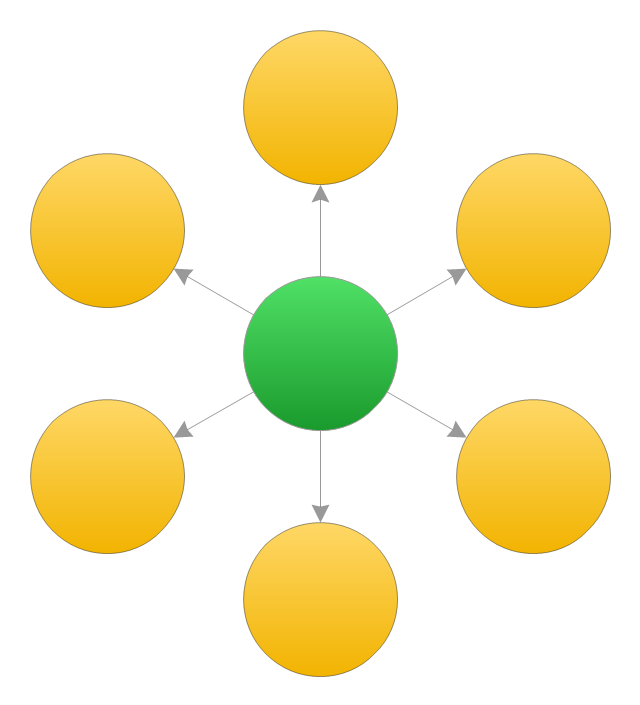
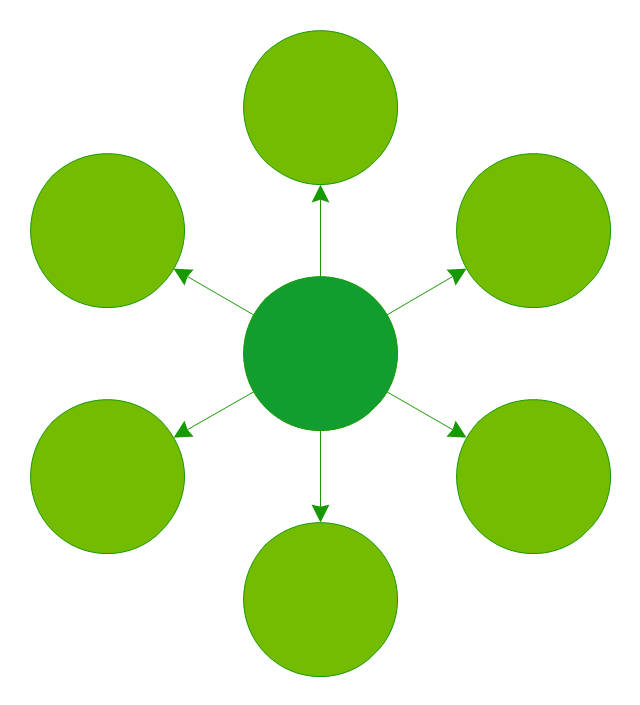
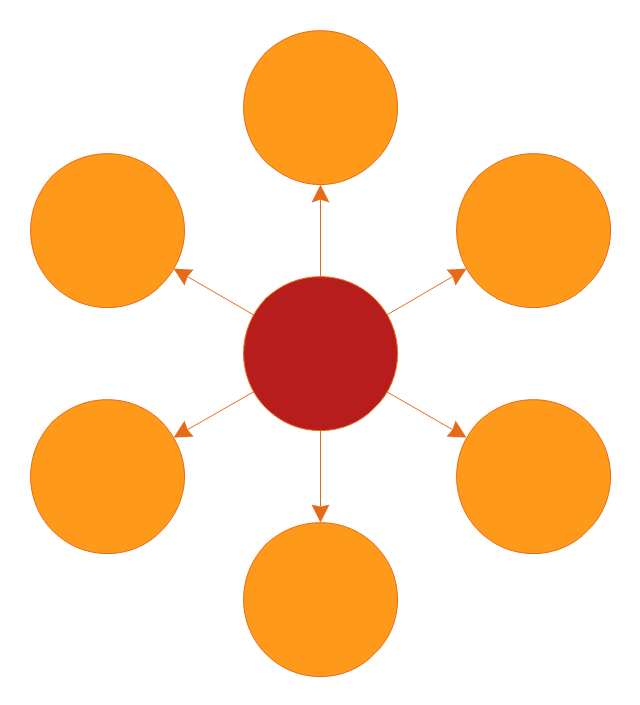
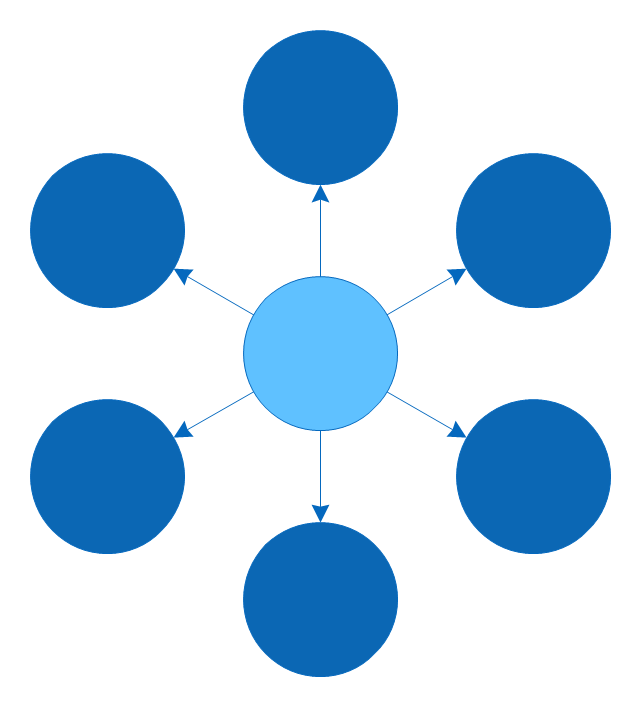
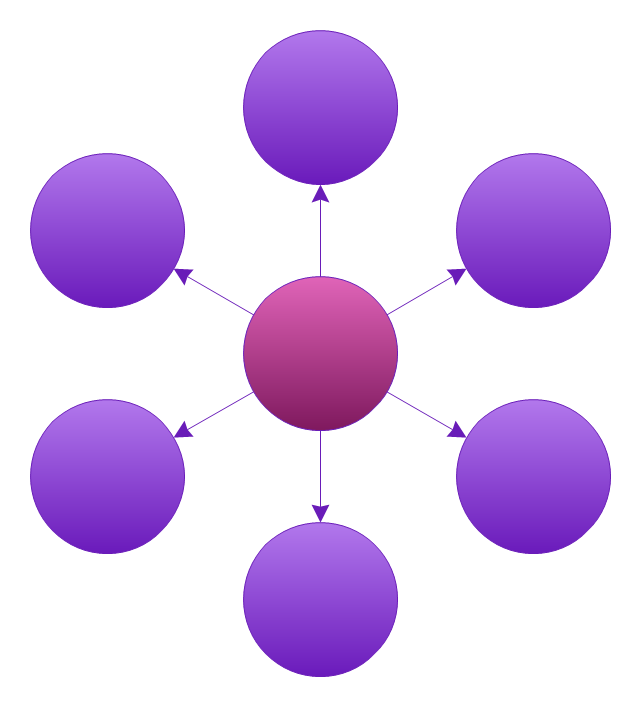
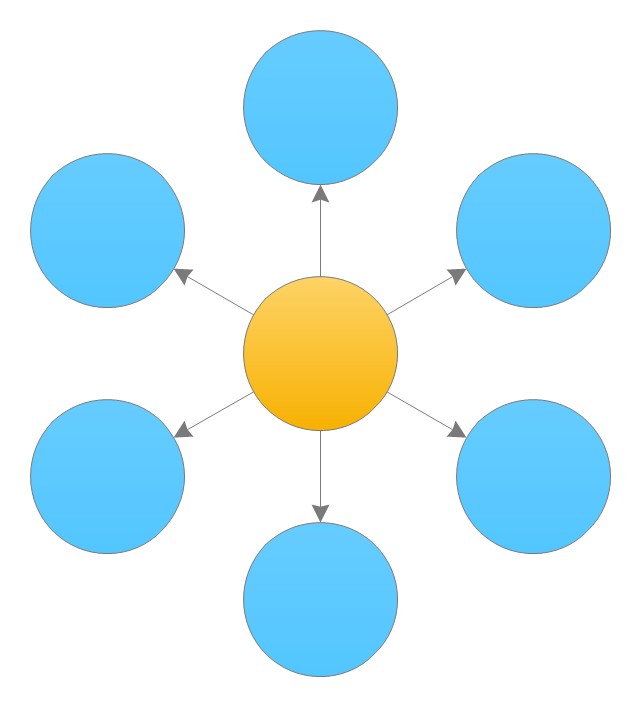
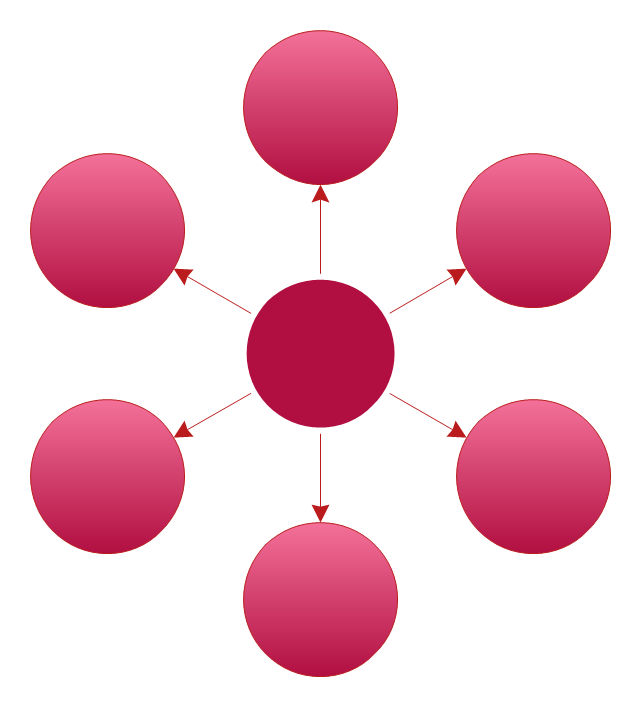
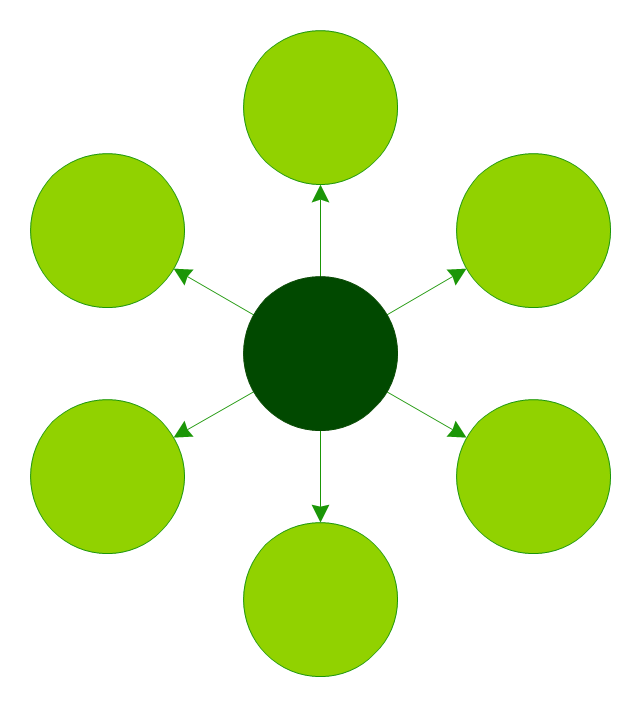
The vector stencils library "Circle-spoke diagram" contains 8 templates of circle-spoke diagrams.
Use these shapes to draw your circle spoke diagrams in the ConceptDraw PRO diagramming and vector drawing software extended with the Circle-Spoke Diagrams solution from the area "What is a Diagram" of ConceptDraw Solution Park.
Use these shapes to draw your circle spoke diagrams in the ConceptDraw PRO diagramming and vector drawing software extended with the Circle-Spoke Diagrams solution from the area "What is a Diagram" of ConceptDraw Solution Park.
Circle-Spoke Diagram 1
Circle-Spoke Diagram 2
Circle-Spoke Diagram 3
Circle-spoke diagram 4
Circle-Spoke Diagram 5
Circle-Spoke Diagram 6
Circle-Spoke Diagram 7
Circle-Spoke Diagram 8
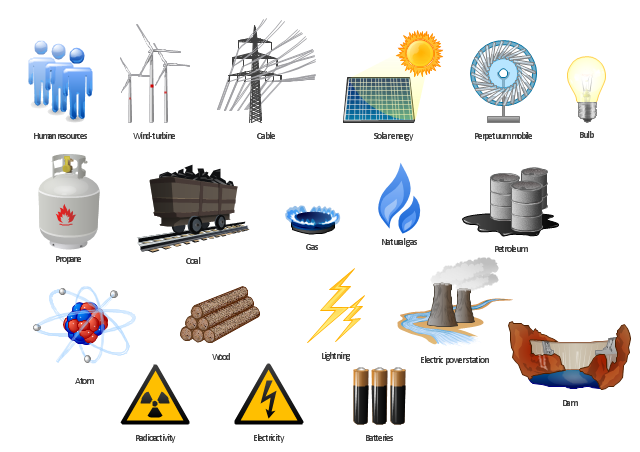
The vector stencils library "Resources and energy" for the ConceptDraw PRO diagramming and vector drawing software contains 19 clip art images of energy symbols and natural resources.
"A resource is a source or supply from which benefit is produced. Typically resources are materials, money, services, staff, or other assets that are transformed to produce benefit and in the process may be consumed or made unavailable. Benefits of resource utilization may include increased wealth, meeting needs or wants, proper functioning of a system, or enhanced well being. From a human perspective a natural resource is anything obtained from the environment to satisfy human needs and wants. From a broader biological or ecological perspective a resource satisfies the needs of a living organism.
The concept of resources has been applied in diverse realms, including with respect to economics, biology, computer science, land management, and human resources, and is linked to the concepts of competition, sustainability, conservation, and stewardship. In application within human society, commercial or non-commercial factors require resource allocation through resource management. " [Resource. Wikipedia]
The vector clipart library "Resources and energy" is included the Manufacturing and Maintenance solution from the Illustration area of ConceptDraw Solution Park.
Vector clip art
Map of Germany — Saarland State
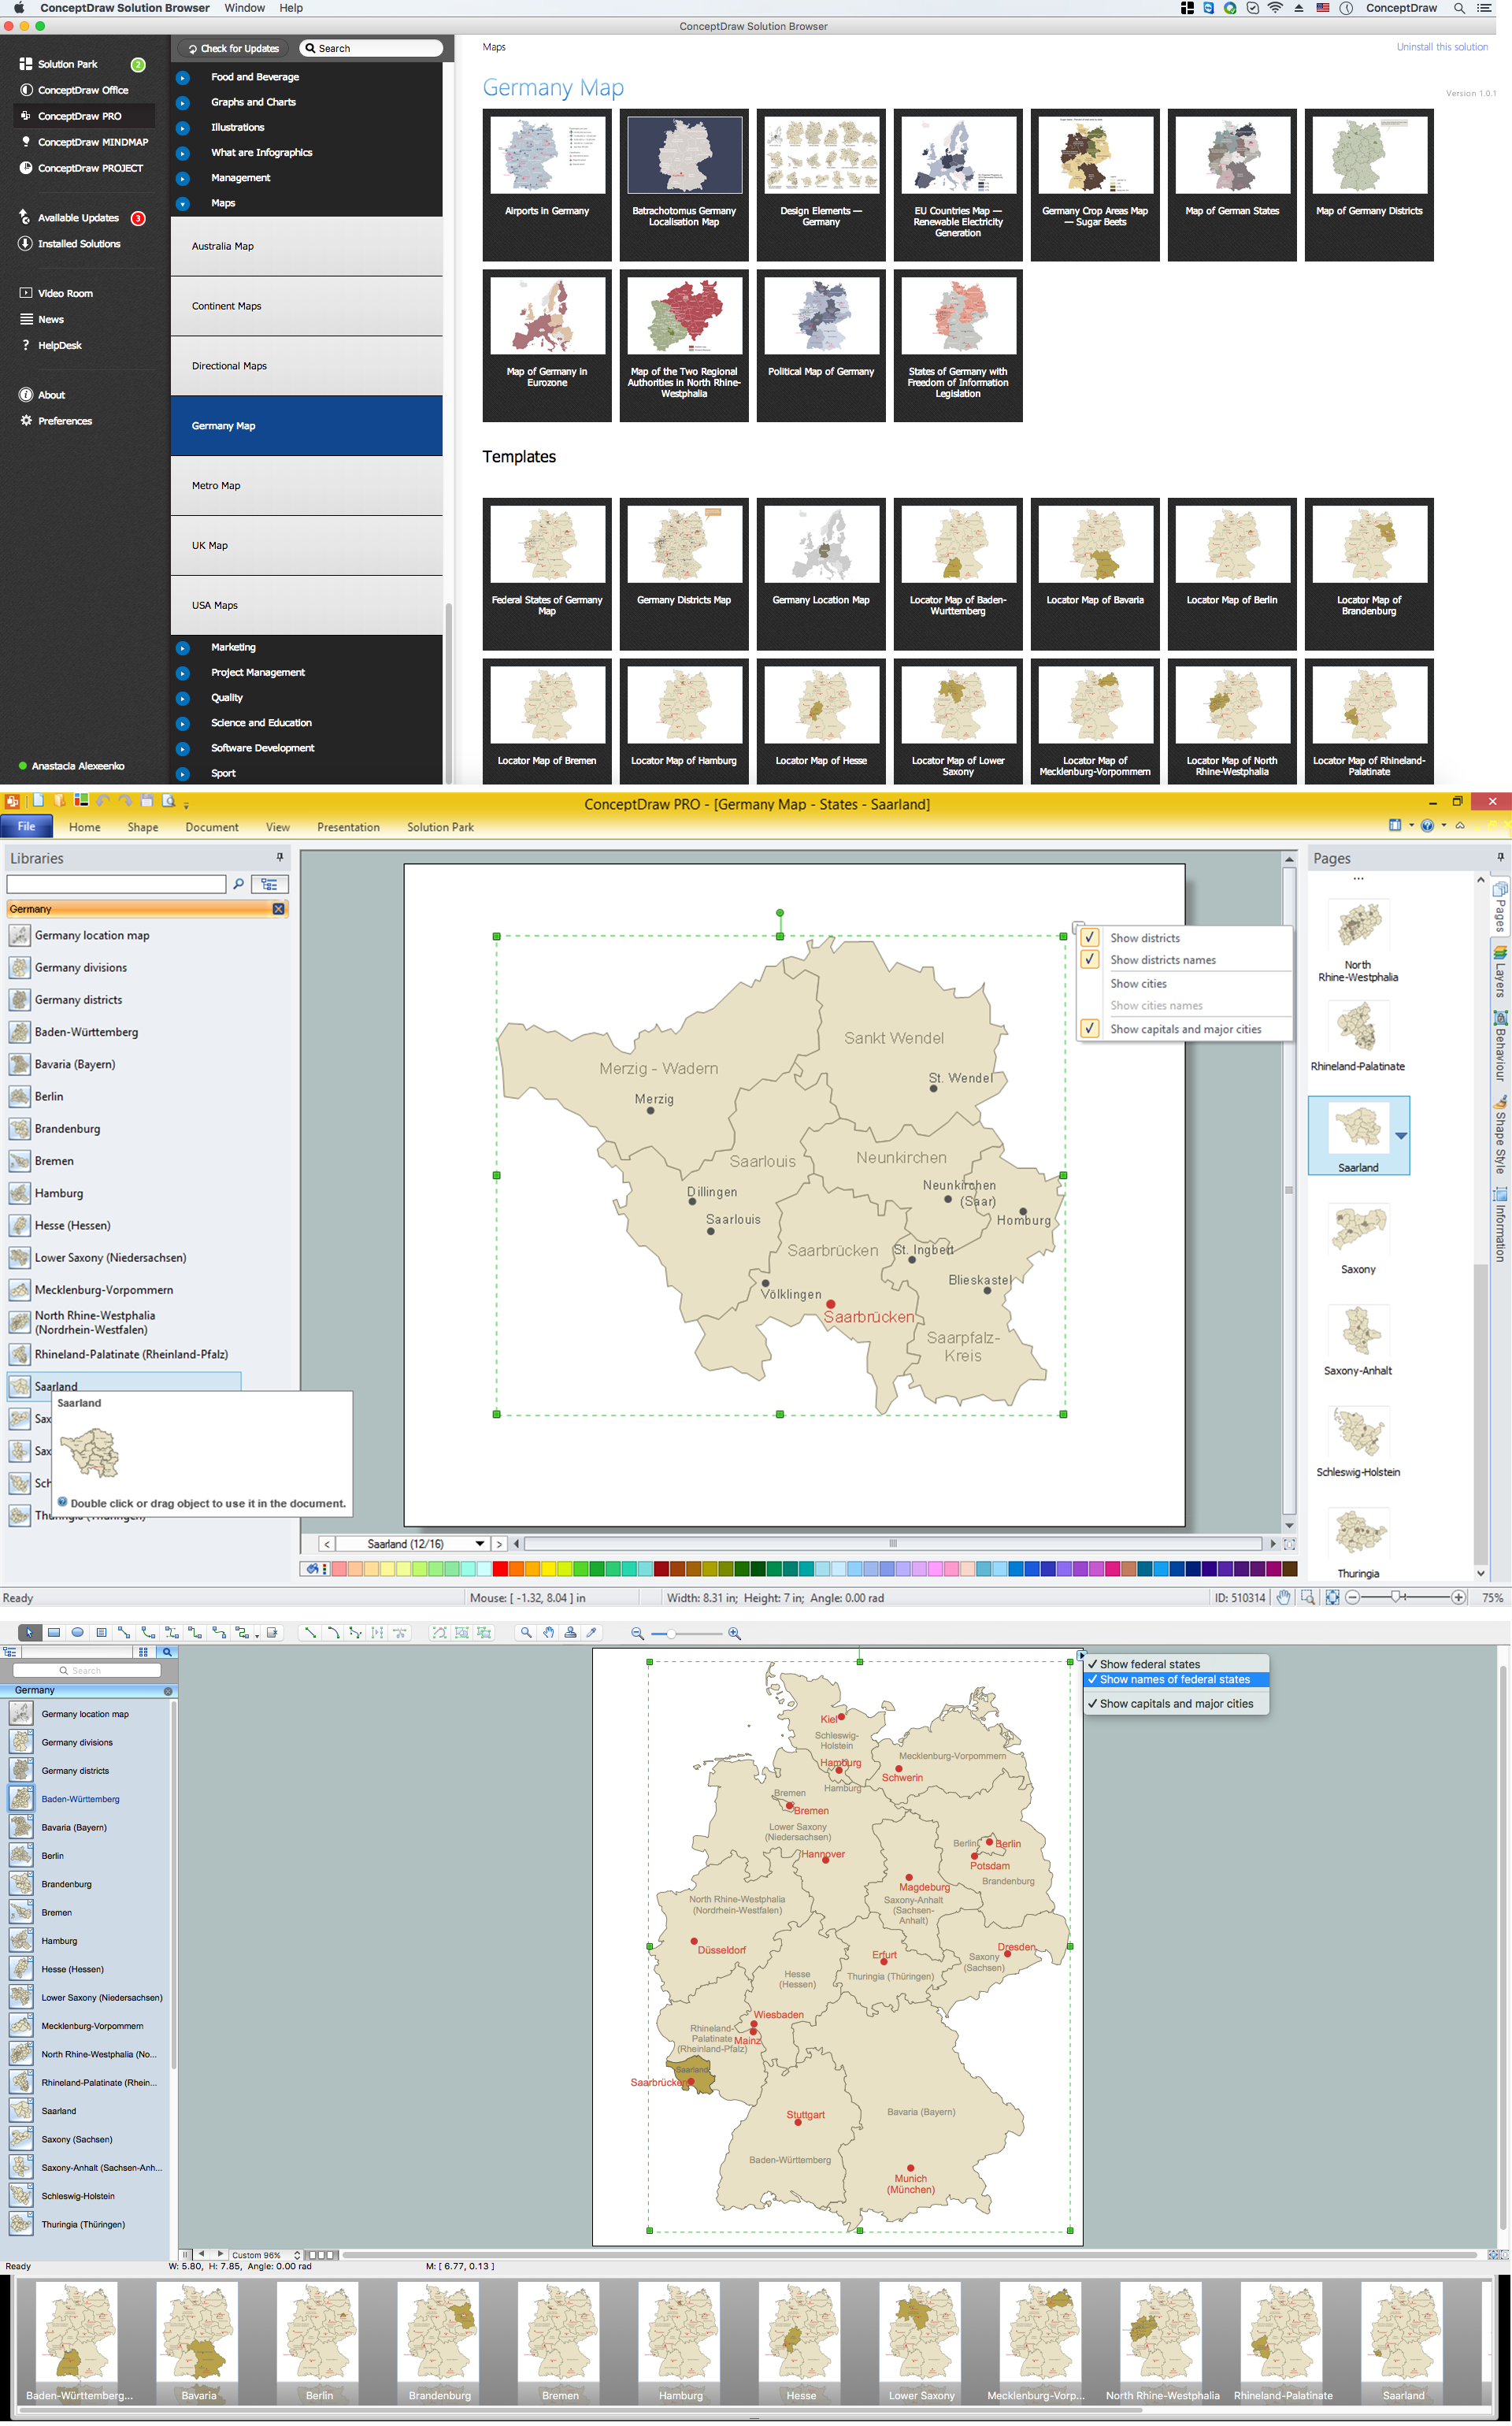
Despite the fact that the maps surround us everywhere in our life, usually the process of their drawing is sufficienly complex and labor-intensive. But now, thanks to the ConceptDraw DIAGRAM diagramming and vector drawing software extended with Germany Map Solution from the Maps Area of ConceptDraw Solution Park, we have the possibility to make easier this process. Design fast and easy your own pictorial maps of Germany, map of Germany with cities, and thematic Germany maps in ConceptDraw DIAGRAM!
Star Network Topology

Use it to draw the physical and logical network topology diagrams for wired and wireless computer communication networks.

Example of DFD for Online Store (Data Flow Diagram)

Example of DFD for Online Store shows the Data Flow Diagram for online store and interactions between the Visitors, Customers and Sellers, as well as Website Information and User databases.

This circle-spoke diagram sample shows the social determinants of health. It was created on the base of the hub-and-spoke diagram from the Health Canada website. [hc-sc.gc.ca/ sr-sr/ pubs/ hpr-rpms/ bull/ 2005-climat/ 2005-climat-6-eng.php]
"Social determinants of health are the economic and social conditions – and their distribution among the population – that influence individual and group differences in health status. They are risk factors found in one's living and working conditions (such as the distribution of income, wealth, influence, and power), rather than individual factors (such as behavioural risk factors or genetics) that influence the risk for a disease, or vulnerability to disease or injury. According to some viewpoints, these distributions of social determinants are shaped by public policies that reflect the influence of prevailing political ideologies of those governing a jurisdiction. ...
In 2003, the World Health Organization (WHO) Europe suggested that the social determinants of health included:
(1) Social gradients (life expectancy is shorter and disease is more common further down the social ladder).
(2) Stress (including stress in the workplace).
(3) Early childhood development.
(4) Social exclusion.
(5) Unemployment.
(6) Social support networks.
(7) Addiction.
(8) Availability of healthy food.
(9) Availability of healthy transportation." [Social determinants of health. Wikipedia]
The hub-and-spoke diagram example "Social determinants of health" was created using the ConceptDraw PRO diagramming and vector drawing software extended with the Circle-Spoke Diagrams solution from the area "What is a Diagram" of ConceptDraw Solution Park.
Circle-spoke diagram

Blank Scatter Plot
Flowchart on Bank. Flowchart Examples

This sample shows the Flowchart of the Subprime Mortgage Crisis. This Flowchart describes the decline in housing prices when the housing bubble burst and what it caused on the housing and financial markets. You can also see the Government and Industry responses in this crisis situation.

Network Topologies

This pie chart sample shows the make up of the top one percent of United States wage earners, grouped by occupation. Data for this graph is sourced from the November 2010 report written by Jon Bakija, Adam Cole, and Bradley T. Heim titled "Jobs and Income Growth of Top Earners and the Causes of Changing Income Inequality: Evidence from U.S. Tax Return Data", column "2005" in table 2, titled "Percentage of primary taxpayers in top one percent of the distribution of income (excluding capital gains) that are in each occupation", on page 50.
This pie chart sample was redesigned from the Wikimedia Commons file: Percentage of the top 1% wage earners in the United States by occupation (pie chart).svg.
[commons.wikimedia.org/ wiki/ File:Percentage_ of_ the_ top_ 1%25_ wage_ earners_ in_ the_ United_ States_ by_ occupation_ (pie_ chart).svg]
This file is licensed under the Creative Commons Attribution-Share Alike 3.0 Unported license. [creativecommons.org/ licenses/ by-sa/ 3.0/ deed.en]
"The distribution of wealth is a comparison of the wealth of various members or groups in a society. It differs from the distribution of income in that it looks at the distribution of ownership of the assets in a society, rather than the current income of members of that society." [Distribution of wealth. Wikipedia]
The pie chart example "Percentage of the top 1% wage earners in the US by occupation" was created using the ConceptDraw PRO diagramming and vector drawing software extended with the Pie Charts solutiton of the Graphs and Charts area in ConceptDraw Solution Park.
Pie chart

Flowchart Marketing Process. Flowchart Examples

Using the ready-to-use predesigned objects, samples and templates from the Flowcharts Solution for ConceptDraw DIAGRAM you can create your own professional looking Flowchart Diagrams quick and easy.
Flowchart Examples and Templates

- European country flags - Vector stencils library
- Stars and planets - Vector stencils library
- Road transport - Vector stencils library
- Design elements - Resources and energy | Rail transport - Vector ...
- Best Vector Drawing Application for Mac OS X | Chart Examples ...
- Map symbols - Vector stencils library | How to Draw a Map of North ...
- Png Vector Clipart Wood Biomass Wind Turbine Wind Turbine Solar
- Healthy Food Recipes | Healthy Diet | Healthy Foods | Healthy Vector
- Geography - Vector stencils library | How to Draw a Natural ...
- Social determinants of health | Healthy Living Vector Png
- Internet symbols - Vector stencils library | Internet symbols - Vector ...
- Design elements - Resources and energy | Resources and energy ...
- North America - Vector stencils library | North America map with ...
- Design elements - Geography | Geography - Vector stencils library ...
- Health Is Wealth Table Chart Diagram
- Ecology pictograms - Vector stencils library | Ecology pictograms ...
- Circle-spoke diagram - Vector stencils library | Basic Circle-Spoke ...
- Geography - Vector stencils library | Design elements - Geography ...
- Natural Wealth Pie Chart
- Transport map template | Maps | Rail transport - Vector stencils ...
- ERD | Entity Relationship Diagrams, ERD Software for Mac and Win
- Flowchart | Basic Flowchart Symbols and Meaning
- Flowchart | Flowchart Design - Symbols, Shapes, Stencils and Icons
- Flowchart | Flow Chart Symbols
- Electrical | Electrical Drawing - Wiring and Circuits Schematics
- Flowchart | Common Flowchart Symbols
- Flowchart | Common Flowchart Symbols