Best Vector Drawing Application for Mac OS X

Online Diagram Tool
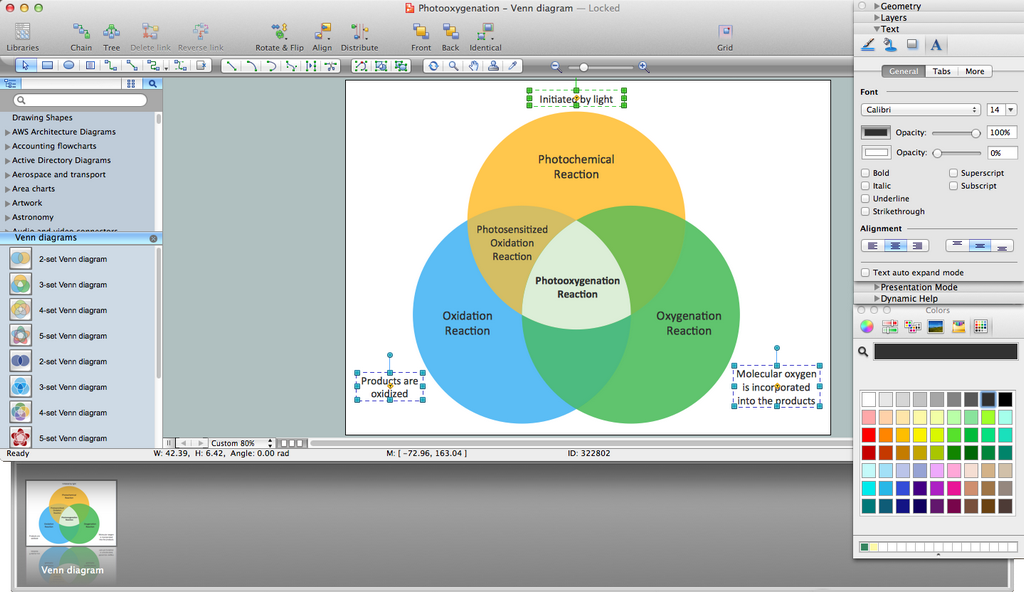
Venn Diagram Maker
Scrum

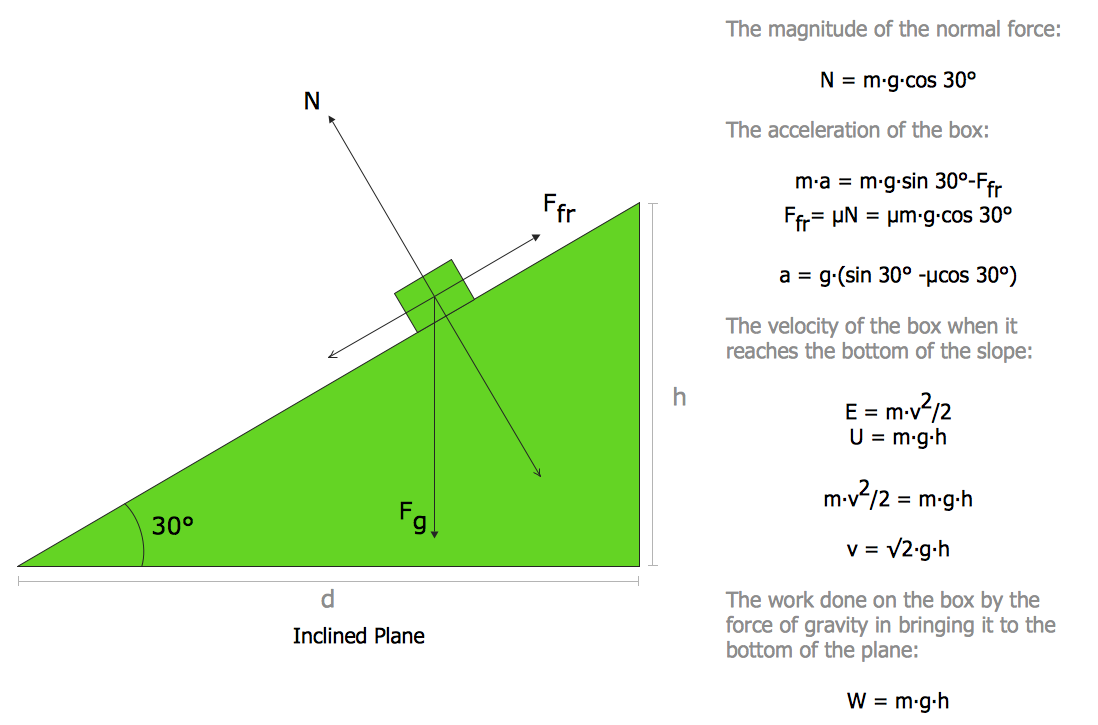
Physics Diagrams
Influence Diagram Software

This sample shows the Influence diagram. It is a directed acyclic graph with three types of nodes: Decision node is drawn as a rectangle, Uncertainty node is drawn as an oval, Value node is drawn as an octagon. The nodes are connected with arcs.
Onion Diagram Maker

ConceptDraw DIAGRAM diagramming and vector drawing software extended with Stakeholder Onion Diagrams Solution from the Management Area of ConceptDraw Solution Park is a professional Onion Diagram Maker.
Flow Chart Symbols

Flowchart diagrams consists of symbols of process, decision, data and document, data base, termination or initiation processes, processing loops and conditions. To create an drawn flowchart use professional flowchart maker of ConceptDraw DIAGRAM.
Stakeholder Mapping Tool

ConceptDraw DIAGRAM diagramming and vector drawing software extended with Stakeholder Onion Diagrams Solution from the Management Area of ConceptDraw Solution Park is a powerful stakeholder mapping tool which allows easy create Stakeholder Onion diagrams and maps depicting the layers of a project, relationships of stakeholders to a project goal, and relationships between stakeholders.
Best Diagramming


- Vector Diagram Creator
- Vector Diagram Maker
- Best Vector Drawing Application for Mac OS X | Venn Diagram ...
- Vector Graphic Diagram
- Create Vector Graphs Chart In Mac
- Venn Diagrams | Venn diagrams - Vector stencils library | Venn ...
- Concept maps - Vector stencils library | Spider Diagram
- Biology Drawing Software | How to Draw Biology Diagram in ...
- Stakeholder Management System | Onion Diagram Maker ...
- ER diagram tool for OS X | Best Vector Drawing Application for Mac ...
- ERD | Entity Relationship Diagrams, ERD Software for Mac and Win
- Flowchart | Basic Flowchart Symbols and Meaning
- Flowchart | Flowchart Design - Symbols, Shapes, Stencils and Icons
- Flowchart | Flow Chart Symbols
- Electrical | Electrical Drawing - Wiring and Circuits Schematics
- Flowchart | Common Flowchart Symbols
- Flowchart | Common Flowchart Symbols