Blank Calendar Template

Business Calendar

Fishbone Diagram Template

ConceptDraw DIAGRAM diagramming and vector drawing software enhanced with Fishbone Diagrams solution helps you create business productivity diagrams from Fishbone diagram templates and examples, that provide to start using of the graphic method for the analysis of problem causes. Each predesigned Fishbone Diagram template is ready to use and useful for instantly drawing your own Fishbone Diagram.
How to Draw an Effective Flowchart

Blank Scatter Plot
 Calendars
Calendars solution extends ConceptDraw DIAGRAM software with templates, samples and library of vector stencils for drawing the business calendars and schedules.
Stakeholder Mapping Tool

ConceptDraw DIAGRAM diagramming and vector drawing software extended with Stakeholder Onion Diagrams Solution from the Management Area of ConceptDraw Solution Park is a powerful stakeholder mapping tool which allows easy create Stakeholder Onion diagrams and maps depicting the layers of a project, relationships of stakeholders to a project goal, and relationships between stakeholders.
Donut Chart Templates

All these donut chart templates are included in the Pie Charts solution.
You can quickly rework these examples into your own charts by simply changing displayed data, title and legend texts.
Examples of Flowcharts, Org Charts and More


 Fishbone Diagram
Fishbone Diagrams solution extends ConceptDraw DIAGRAM software with templates, samples and library of vector stencils for drawing the Ishikawa diagrams for cause and effect analysis.
Onion Diagram Templates

Design of Onion Diagrams and Stakeholder Onions Diagrams is a complex process, but ConceptDraw DIAGRAM diagramming and vector drawing software makes it easier thanks to the Stakeholder Onion Diagrams Solution from the Management Area of ConceptDraw Solution Park, and the set of included libraries and Onion Diagram templates.
 macOS User Interface
macOS User Interface solution extends the ConceptDraw DIAGRAM functionality with powerful GUI software graphic design features and tools. It provides an extensive range of multifarious macOS Sierra user interface design examples, samples and templates, and wide variety of libraries, containing a lot of pre-designed vector objects of Mac Apps icons, buttons, dialogs, menu bars, indicators, pointers, controls, toolbars, menus, and other elements for fast and simple designing high standard user interfaces of any complexity for new macOS Sierra.
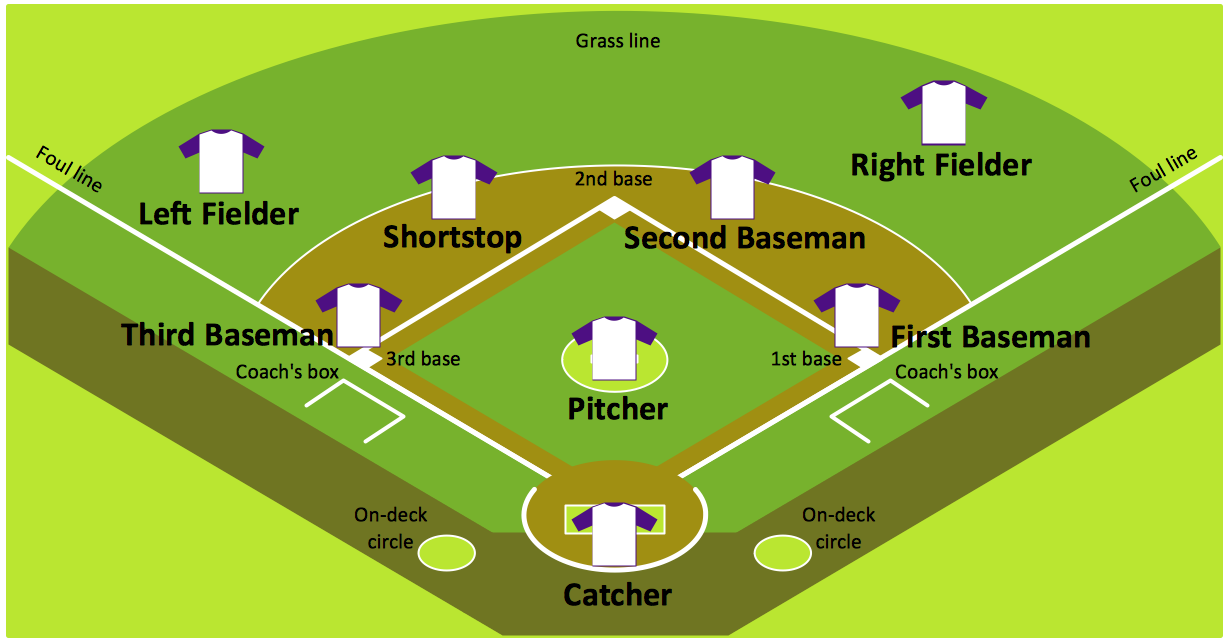
Baseball Diagram — Baseball Field — Corner View — Sample
 iPhone User Interface
iPhone User Interface solution extends ConceptDraw DIAGRAM software with templates, samples and libraries with large quantity of vector stencils of graphical user interface elements, Apps icons, UI patterns for designing and prototyping of the iOS applic
SWOT Matrix Template

- Hd Vector Png Image Of Calendar
- Time and clock pictograms - Vector stencils library | Time and clock ...
- White Circle Png Vector
- 24 Hours Icon Illustration Png
- Png In 24 Hours
- How to Edit a Project Task List | Calendars - Vector stencils library ...
- Time and clock pictograms - Vector stencils library | ERD Symbols ...
- Half Circle Png
- White Circle Png Transparent
- Books Circle Icon Png
- Calendars - Vector stencils library | Png 32x32 Tick Image Black
- White Circle Outline Png
- Calendars - Vector stencils library | Flowchart design. Flowchart ...
- Calender Png Vector
- Calendars - Vector stencils library | Tick Vector Png Small
- Calendars - Vector stencils library | White Decorative Line Png
- Calendar Symbol Png
- Calendars - Vector stencils library | Astronomy | Moon Phases Icon ...
- UML Class Diagram Constructor | How to Draw a Circle -Spoke ...
- Star Shaped Button Png
- ERD | Entity Relationship Diagrams, ERD Software for Mac and Win
- Flowchart | Basic Flowchart Symbols and Meaning
- Flowchart | Flowchart Design - Symbols, Shapes, Stencils and Icons
- Flowchart | Flow Chart Symbols
- Electrical | Electrical Drawing - Wiring and Circuits Schematics
- Flowchart | Common Flowchart Symbols
- Flowchart | Common Flowchart Symbols