Pyramid Charts

A Pyramid Chart has the form of triangle and hierarchically structures, organizes and help to analyze the information, data or ideas. Triangle is divided on the sections that usually have different widths. The width indicates the level of hierarchy among the topics.
Pyramid Diagram and Pyramid Chart

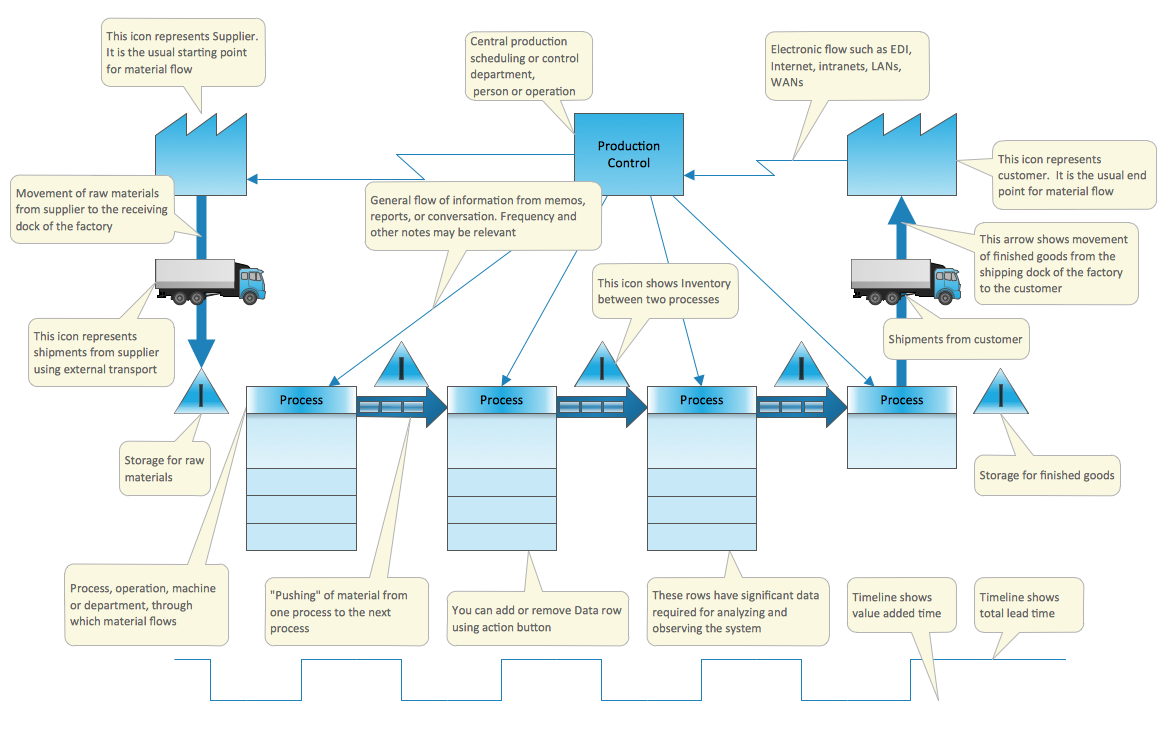
Value Stream Mapping Template
How to Create a Pyramid Diagram

Six Markets Model Chart Template

Donut Chart Templates

All these donut chart templates are included in the Pie Charts solution.
You can quickly rework these examples into your own charts by simply changing displayed data, title and legend texts.
Pie Chart Examples and Templates

Pie chart examples and templates created using ConceptDraw DIAGRAM software helps you get closer with pie charts and find pie chart examples suite your needs.
Pyramid Chart Examples

Pyramid Diagram

How to Create a Column Chart

- Market Value Pyramid
- Market value - Pyramid diagram | Pyramid diagram - Template ...
- Pyramid diagram - Template | Pyramid Diagram and Pyramid Chart ...
- Pyramid Diagram and Pyramid Chart | Circle Spoke Diagram ...
- Triangle Graph Template
- Pyramid diagram - Template
- Pyramid Diagram and Pyramid Chart | Triangle chart - Template ...
- Market value - Pyramid diagram
- Pyramid Diagram and Pyramid Chart | Pyramid diagram - Template ...
- Pyramid Diagram Template
- ERD | Entity Relationship Diagrams, ERD Software for Mac and Win
- Flowchart | Basic Flowchart Symbols and Meaning
- Flowchart | Flowchart Design - Symbols, Shapes, Stencils and Icons
- Flowchart | Flow Chart Symbols
- Electrical | Electrical Drawing - Wiring and Circuits Schematics
- Flowchart | Common Flowchart Symbols
- Flowchart | Common Flowchart Symbols