Porter's Value Chain

Value Stream Mapping Symbols

The vector stencils library "Shipping and receiving" contains 18 symbols of industrial shipping and receiving equipment.
Use the design elements library "Shipping and receiving" to draw factory warehouse equipment layout plans, floor plans of shipping and receiving centers with equipment for hauling, transporting, and distributing manufactured goods, freight, cargo, and stock from plants and industrial facilities using the ConceptDraw PRO diagramming and vector drawing software.
"Freight transport, or shipping, is a key in the value chain in manufacturing.
While all modes of transport are used for cargo transport, there is high differentiation between the nature of the cargo transport, in which mode is chosen.
Logistics refers to the entire process of transferring products from producer to consumer, including storage, transport, transshipment, warehousing, material-handling and packaging, with associated exchange of information.
Containerization, with the standardization of ISO containers on all vehicles and at all ports, has revolutionized international and domestic trade, offering huge reduction in transshipment costs. Traditionally, all cargo had to be manually loaded and unloaded into the haul of any ship or car; containerization allows for automated handling and transfer between modes, and the standardized sizes allow for gains in economy of scale in vehicle operation." [Transport. Freight.
Wikipedia]
This shapes library "Shipping and receiving" is included in the Plant Layout Plans solution from the Building Plans area of ConceptDraw Solution Park.
Shipping and receiving symbols

Software for Creating SWOT Analysis Diagrams

Integration Definition

Competitor Analysis

"A value chain is a chain of activities that a firm operating in a specific industry performs in order to deliver a valuable product or service for the market. ...
The concept of value chains as decision support tools, was added onto the competitive strategies paradigm developed by Porter as early as 1979. In Porter's value chains, Inbound Logistics, Operations, Outbound Logistics, Marketing and Sales and Service are categorized as primary activities. Secondary activities include Procurement, Human Resource management, Technological Development and Infrastructure." [Value chain. Wikipedia]
This Porter's value chain matrix diagram example was created using the ConceptDraw PRO diagramming and vector drawing software extended with the Matrices solution from the Marketing area of ConceptDraw Solution Park.
Porter's value chain matrix

Best Value Stream Mapping mac Software

Business Process Modeling with EPC

ConceptDraw DIAGRAM - software that reduces the time needed to create a business process model.
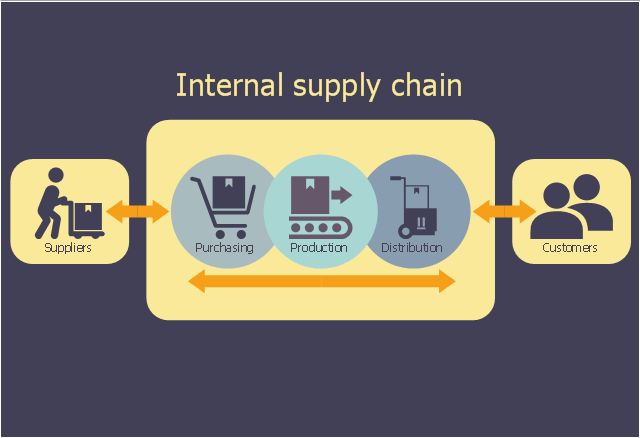
This logistic flow chart sample shows the company's supply chain. It was designed on the base of the Wikimedia Commons file: A company's supply chain (en).png. [commons.wikimedia.org/ wiki/ File:A_ company%27s_ supply_ chain_ (en).png]
This file is licensed under the Creative Commons Attribution-Share Alike 3.0 Unported license. [creativecommons.org/ licenses/ by-sa/ 3.0/ deed.en]
"A supply chain is a system of organizations, people, activities, information, and resources involved in moving a product or service from supplier to customer. Supply chain activities involve the transformation of natural resources, raw materials, and components into a finished product that is delivered to the end customer. In sophisticated supply chain systems, used products may re-enter the supply chain at any point where residual value is recyclable. Supply chains link value chains." [Supply chain. Wikipedia]
The logistic flowchart example "A company's supply chain" was created using ConceptDraw PRO diagramming and vector drawing software extended with the Logistics Flow Charts solution from the Business Processes area of ConceptDraw Solution Park.
Logistic flowchart
Basic Flowchart Symbols and Meaning


Quality Engineering Diagrams

This step chart sample shows engineering value chain. It was designed on the base of the Wikimedia Commons file: The engineering value chain.png. "The engineering value chain (EVC) refers to a series of engineering activities and capabilities contributing to value creation encompassing essential elements such as idea generation & selection, design & development, production & delivery, service & support, and disposal & recycling for example." [commons.wikimedia.org/ wiki/ File:The_ engineering_ value_ chain.png]
This file is licensed under the Creative Commons Attribution-Share Alike 3.0 Unported license. [creativecommons.org/ licenses/ by-sa/ 3.0/ deed.en]
The diagram example "Step chart - Value chain" was created using the ConceptDraw PRO diagramming and vector drawing software extended with the Marketing Diagrams solution from the Marketing area of ConceptDraw Solution Park.
Marketing diagram

Business Process Flowchart Symbols

Swot Analysis Examples

SWOT Sample in Computers

Best Flowchart Software and Flowchart Symbols

Feature Comparison Chart Software

This sample shows the Feature Comparison Chart of the digital scouting cameras. It can be useful for digital cameras production field, marketing, sales, etc.
Entity Relationship Diagram Symbols

ERD symbols used for professional ERD drawing are collected in libraries from the Entity-Relationship Diagram (ERD) solution for ConceptDraw DIAGRAM.
Physics Symbols

Physics solution provides all tools that you can need for physics diagrams designing. It includes 3 libraries with predesigned vector physics symbols: Optics Library, Mechanics Library and Nuclear Physics Library.
- Value Stream Mapping Symbols | Process Flowchart | EPC ...
- Porter's Value Chain | VSM | Process Flowchart | Value Chain Visio
- Flow chart Example. Warehouse Flowchart | Porter's Value Chain ...
- Supply Chain Symbols Flowchart In Visio
- Process Flowchart | Total Quality Management Definition | Cross ...
- Supply Chain Flow Chart Template
- Supply Chain Mapping Template Excel
- Visio Supply Chain Template
- Porters Value Chain Analysis For Real Estate Company
- Value Chain In Plumbing
- Porter's Value Chain | Process Flowchart | Logistics Flow Charts ...
- Supply Chain Process Flow Chart Templates
- Supply chain network | A company's supply chain | Omnichannel ...
- Download Logistics And Supply Chain Management In Visio
- Flowchart Marketing Process. Flowchart Examples | Types of ...
- Business Process Modeling | Business Process Diagrams | Porter's ...
- Porter's value chain matrix diagram | Event-driven Process Chain ...
- What is Value Stream Mapping? | Value Stream Mapping Symbols ...
- Visio Epc Symbols
- Porter's Value Chain | Logistics Flow Charts | EPC - Business ...
- ERD | Entity Relationship Diagrams, ERD Software for Mac and Win
- Flowchart | Basic Flowchart Symbols and Meaning
- Flowchart | Flowchart Design - Symbols, Shapes, Stencils and Icons
- Flowchart | Flow Chart Symbols
- Electrical | Electrical Drawing - Wiring and Circuits Schematics
- Flowchart | Common Flowchart Symbols
- Flowchart | Common Flowchart Symbols