UML Use Case Diagram Example. Registration System

This sample was created in ConceptDraw DIAGRAM diagramming and vector drawing software using the UML Use Case Diagram library of the Rapid UML Solution from the Software Development area of ConceptDraw Solution Park.
This sample shows the types of user’s interactions with the system and is used at the registration and working with the database system.
Flowchart

Business process Flow Chart — Event-Driven Process chain (EPC) diagrams

 Event-driven Process Chain Diagrams
Event-Driven Process Chain Diagrams solution extends ConceptDraw DIAGRAM functionality with event driven process chain templates, samples of EPC engineering and modeling the business processes, and a vector shape library for drawing the EPC diagrams and EPC flowcharts of any complexity. It is one of EPC IT solutions that assist the marketing experts, business specialists, engineers, educators and researchers in resources planning and improving the business processes using the EPC flowchart or EPC diagram. Use the EPC solutions tools to construct the chain of events and functions, to illustrate the structure of a business process control flow, to describe people and tasks for execution the business processes, to identify the inefficient businesses processes and measures required to make them efficient.
Wireframe Examples
EPC (Event-driven Process Chain) Flowcharts
Event-Driven Process Сhain Diagrams for improvement throughout an organisation.
Diagramming Software for Design UML Activity Diagrams


Data Flow Diagram

Formalization and Verification of Event-driven Process chain
ConceptDraw DIAGRAM - software that reduces the time needed to create a business process model.
Work Order Process Flowchart. Business Process Mapping Examples

The cross-functional flow chart example shows business process mapping of the real property work order.
- Taxi Service Data Flow Diagram DFD Example | UML Use Case ...
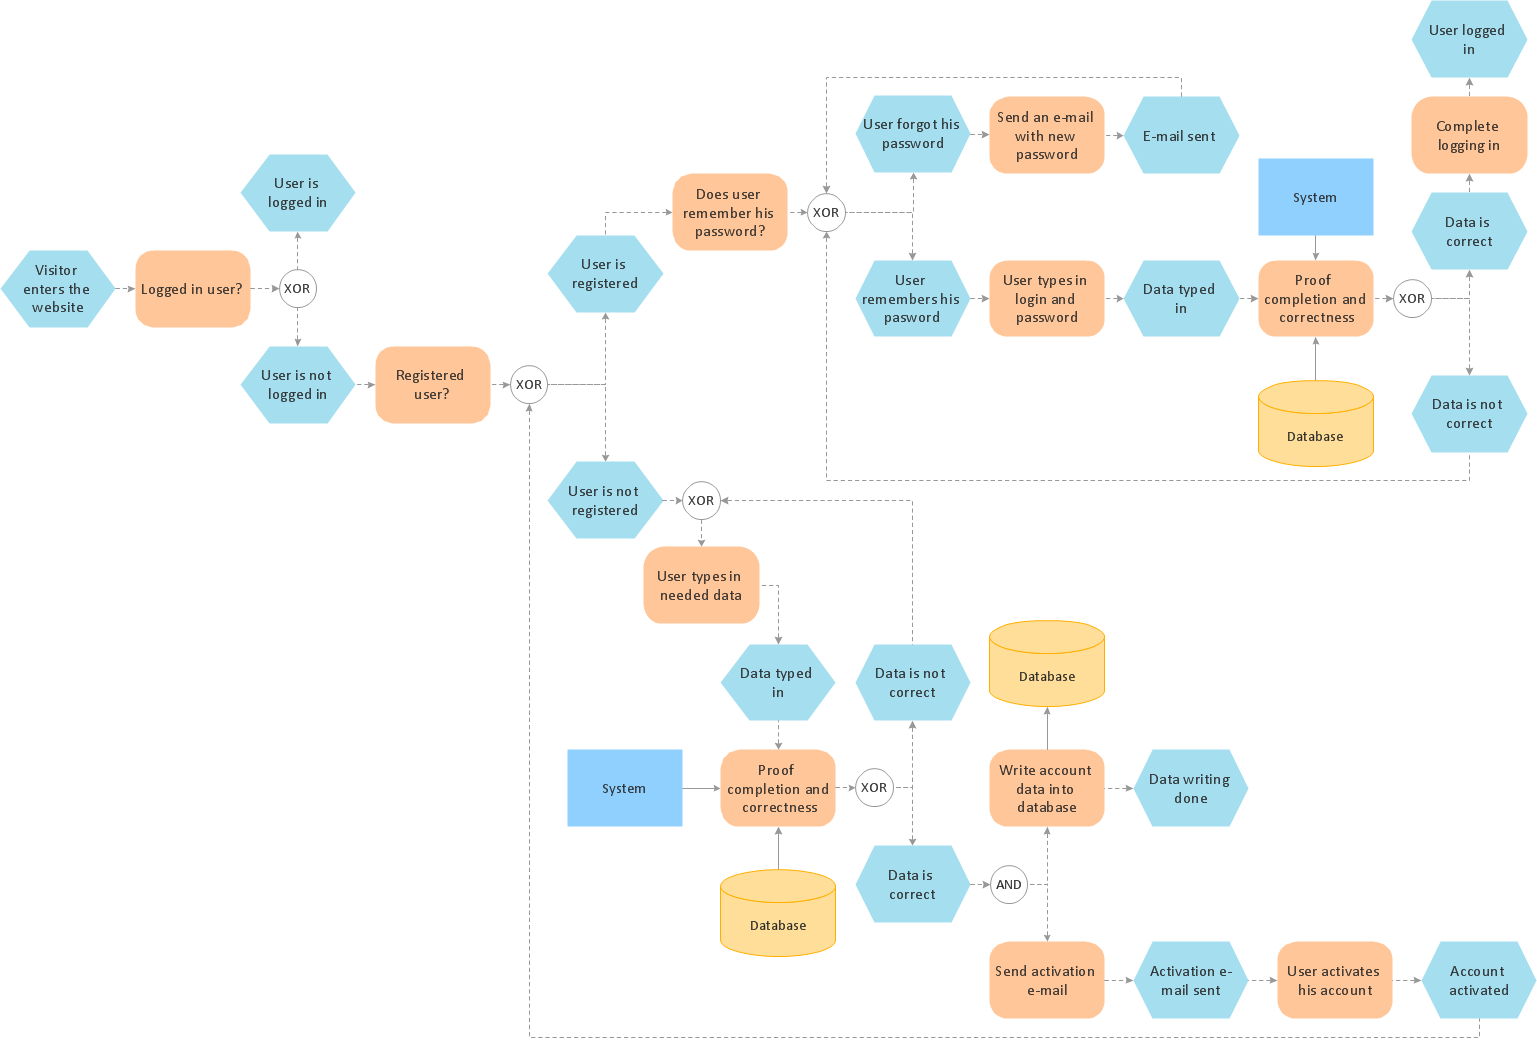
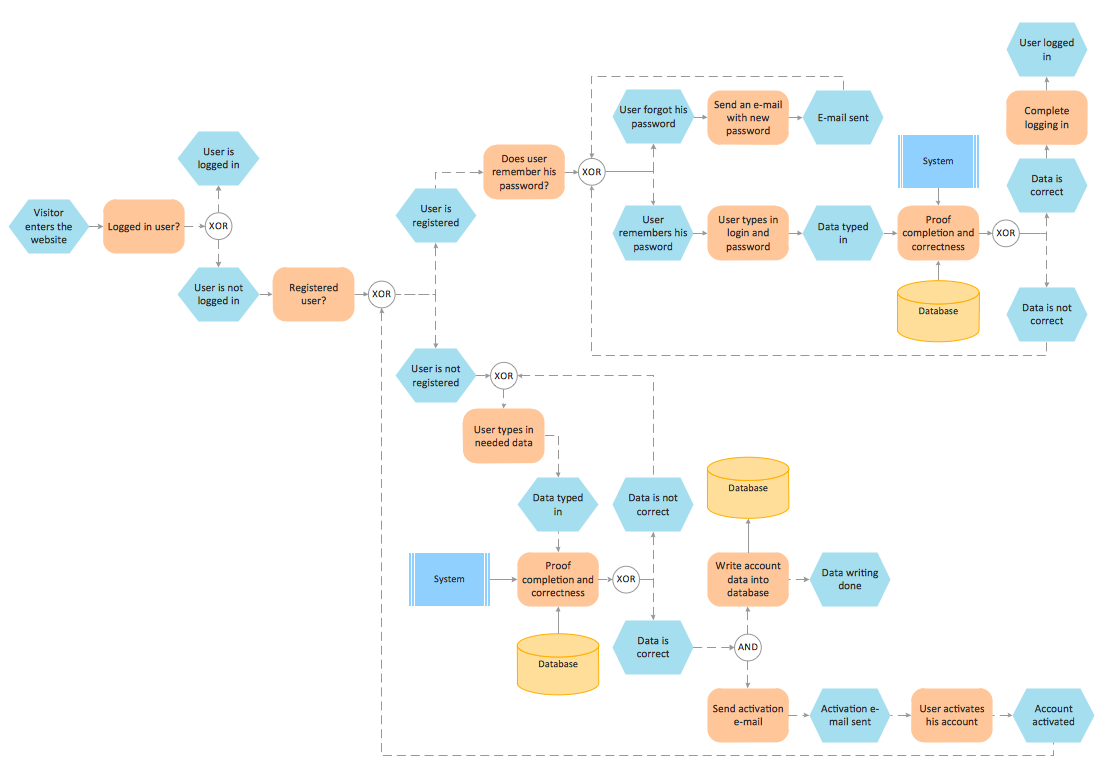
- User Registration Flow Chart
- User Registration Process Flow Diagram
- UML activity diagram - User registration | How to Help Customers be ...
- Flow Chart For Registration Of A User
- Login and registration processing | Login and registration ...
- Data Flow Diagram For User Registration And Login
- Event-driven Process Chain Diagrams | Basic EPC Diagrams ...
- UML activity diagram - User registration | Cross-Functional ...
- Activity Diagram For User Registration
- ERD | Entity Relationship Diagrams, ERD Software for Mac and Win
- Flowchart | Basic Flowchart Symbols and Meaning
- Flowchart | Flowchart Design - Symbols, Shapes, Stencils and Icons
- Flowchart | Flow Chart Symbols
- Electrical | Electrical Drawing - Wiring and Circuits Schematics
- Flowchart | Common Flowchart Symbols
- Flowchart | Common Flowchart Symbols